


Sound Level Meter
14
and B and these data will update automatically when cursor A or B is moving.
You can double click the graph to call the option dialog. In option dialog, it is
allowed to customize your graph style.
And you can right click the graph (real time graph is not allowed) to call out the
popup menu.
You can Zoom this graph by using mouse:
To Zoom:
1. Press the left mouse button and drag the cursor to select the new extents.
2. Release the mouse button.
To Undo the Zoom - Right click on the graph, there will be a pop-up menu,
select Undo Zoom.
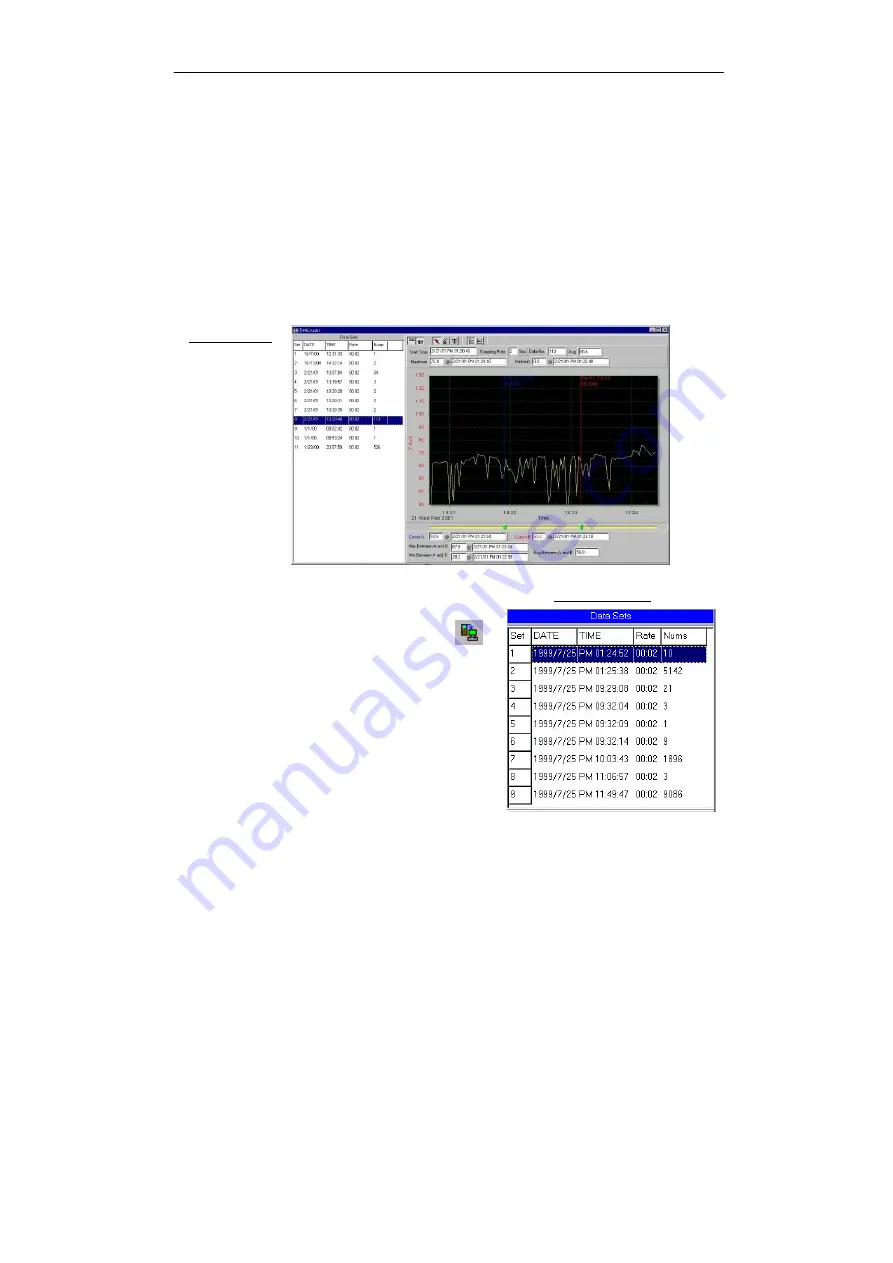
DataLogger
When you have Sound Level DATA
LOGGER meter connected to PC and select
"DataLogger" from main menu or click
from tool bar to load recorded data from the
meter and there will be a progress indicator
to show the loading progress, if error occurs,
just click "DataLogger" again.
After the data was loaded, the left hand side
will show how many data sets were loaded
and detail information for each data set
(start data, start time, recording rate and
record numbers).
for examples: