


272
k
k
k
k
k
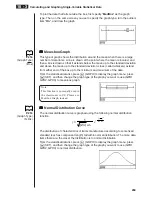
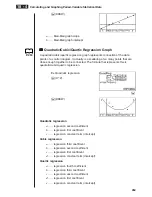
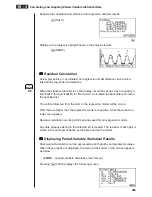
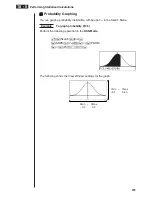
Probability Distribution Calculation and Graphing
You can calculate and graph probability distributions for single-variable statistics.
u
u
u
u
u
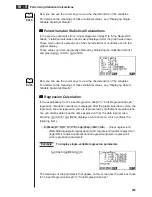
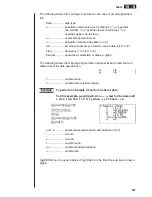
Probability distribution calculations
Use the
RUN Mode
to perform probability distribution calculations. Press
K
in
the RUN Mode to display the option number and then press
6
(
g
)
3
(PROB)
6
(
g
) to display a function menu, which contains the following items.
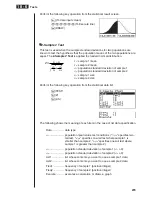
• {
P(
}
/
{
Q(
}
/
{
R(
} ... obtains probability {P(
t
)}/{Q(
t
)}/{R(
t
)} value
• {
t
(
} ... {obtains normalized variate
t
(
x
) value}
• Probability P(
t
), Q(
t
), and R(
t
), and normalized variate
t
(
x
) are calculated using
the following formulas.
P(
t
)
Q(
t
)
R(
t
)
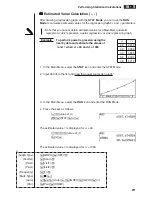
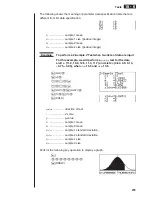
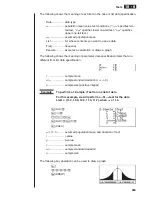
Example
The following table shows the results of measurements of the
height of 20 college students. Determine what percentage of
the students fall in the range 160.5 cm to 175.5 cm. Also, in
what percentile does the 175.5 cm tall student fall?
Class no.
Height (cm)
Frequency
1
158.5
1
2
160.5
1
3
163.3
2
4
167.5
2
5
170.2
3
6
173.3
4
7
175.5
2
8
178.6
2
9
180.4
2
10
186.7
1
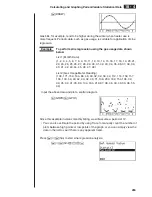
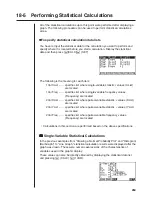
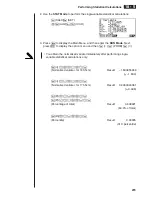
1. In the
STAT Mode
, input the height data into List 1 and the frequency data into
List 2.
18 - 5
Performing Statistical Calculations
Summary of Contents for CFX-9970G
Page 22: ... CFX 9970G ...
Page 452: ...435 1 2 3 4 5 Program for Circle and Tangents No 4 Step Key Operation Display ...
Page 453: ...436 Program for Circle and Tangents No 4 Step Key Operation Display 6 7 8 9 10 ...
Page 454: ...437 11 12 13 14 15 Program for Circle and Tangents No 4 Step Key Operation Display ...
Page 455: ...438 16 17 18 Program for Circle and Tangents No 4 Step Key Operation Display ...
Page 458: ...441 1 2 3 4 5 Program for Rotating a Figure No 5 Step Key Operation Display ...


