background image

19990401

5-2-8

Controlling What Appears on a Graph Screen

# You must specify two different points for box

zoom, and the two points cannot be on a straight
line vertically or horizontally from each other.

○ ○ ○ ○ ○

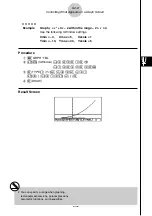
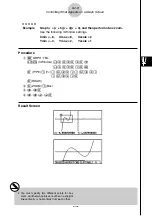
Example

Graph 

y

 = (

x

 + 5)(

x

 + 4)(

x

 + 3), and then perform a box zoom.

Use the following V-Window settings.

Xmin = –8,

Xmax = 8,

Xscale = 2

Ymin = – 4,

Ymax = 2,

Yscale = 1

Procedure

1

m

 GRPH


TBL

!

K

(V-Window)

-

i

w

i

w

c

w

c

-

e

w

c

w

b

w

i

3

(TYPE)

b

(Y=)

(

v

+f)(

v

+e)

(

v

+d)

w

5

(DRAW)

2

2

(ZOOM)

b

(Box)

3

d

~

d

w

4

d

~

d

,

f

~

f

w

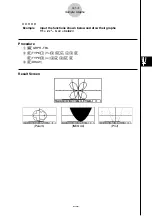
Result Screen

Summary of Contents for ALGEBRA FX 1.0 Plus

Page 1: ...ng or number table generation CONICS Conic section graphing 5 1 5 5 1 6 5 11 17 5 11 21 RUN MAT Manual graphing 5 6 1 5 6 4 DYNA Dynamic Graph 5 8 1 5 8 6 RECUR Recursion graphing or number table generation 5 9 1 5 9 8 5 1 Sample Graphs 5 2 Controlling What Appears on a Graph Screen 5 3 Drawing a Graph 5 4 Storing a Graph in Picture Memory 5 5 Drawing Two Graphs on the Same Screen 5 6 Manual Graph...

Page 2: ...h 1 Description To draw a graph simply input the applicable function Set Up 1 From the Main Menu enter the GRPH TBL Mode Execution 2 Input the function you want to graph Here you would use the V Window to specify the range and other parameters of the graph See 5 2 1 3 Draw the graph ...

Page 3: ...19990401 5 1 2 Sample Graphs Example To graph y 3x2 Procedure 1 m GRPH TBL 2 dvxw 3 5 DRAW or w Result Screen ...

Page 4: ...expression polar coordinate expression parametric function X constant expression inequality 3 TYPE b Y rectangular coordinates c r polar coordinates d Param parametric function e X c X constant function f INEQUA b Y e Y inequality g CONV b Y f Y changes the function type Repeat this step as many times as required to input all of the functions you want Next you should specify which of the functions...

Page 5: ...0401 5 1 4 Sample Graphs Example Input the functions shown below and draw their graphs Y1 2x2 3 r2 3sin2θ Procedure 1 m GRPH TBL 2 3 TYPE b Y cvx dw 3 TYPE c r dscvw 3 5 DRAW Result Screen Param INEQUA Plot ...

Page 6: ...1 From the Main Menu enter the CONICS Mode Execution 2 Use the cursor fc keys to specify one of the function type as follows 3 Input values for the required variables 4 Graph the function Graph Type Function Parabola X A Y K 2 H X AY2 BY C Y A X H 2 K Y AX2 BX C Circle X H 2 Y K 2 R2 AX2 AY2 BX CY D 0 Ellipse X H 2 Y K 2 1 A2 B2 Hyperbola X H 2 Y K 2 1 A2 B2 Y K 2 X H 2 1 A2 B2 ...

Page 7: ...19990401 5 1 6 Sample Graphs Example Graph the circle X 1 2 Y 1 2 22 Procedure 1 m CONICS 2 ccccw 3 bwbwcw 4 6 DRAW Result Screen Parabola Ellipse Hyperbola ...

Page 8: ...ements Xdot Value that corresponds to one x axis dot Ymin Minimum y axis value Ymax Maximum y axis value Yscale Spacing of y axis increments Polar coordinate parameter Tθ min T θ minimum values Tθ max T θ maximum values Tθ ptch T θ pitch 3 Press c to move the highlighting and input an appropriate value for each parameter pressing w after each INIT TRIG STD V Window initial settings initial setting...

Page 9: ...ging the V Window settings clears the graph currently on the display and replaces it with the new axes only Changing the Xmin or Xmax value causes the Xdot value to be adjusted automatically Changing the Xdot value causes the Xmax value to be adjusted automatically A polar coordinate r or parametric graph will appear coarse if the settings you make in the V Window cause the T θ pitch value to be t...

Page 10: ...ngle unit Xmin 3π rad Xmax 3π rad Xscale π 2 rad Xdot π 21 rad Ymin 1 6 Ymax 1 6 Yscale 0 5 u To standardize the V Window The following are the standard V Window settings of this calculator Xmin 10 Xmax 10 Xscale 1 Xdot 0 15873015 Ymin 10 Ymax 10 Yscale 1 Tθ min 0 Tθ max 2π rad Tθ ptch 2π 60 rad In step 3 of the procedure under To initialize the V Window above press 3 STD to standardize V Window s...

Page 11: ... settings in V Window Memory 1 V Win1 u To recall V Window memory settings 1 From the Main Menu enter the GRPH TBL Mode 2 Press K V Window to display the V Window setting screen 3 Press 5 RCL to display the pop up window 4 Press a number key to specify the V Window memory number for the settings you want to recall and then press w Pressing bw recalls the settings in V Window Memory 1 V Win1 5 2 4 ...

Page 12: ... function before graphing it Set Up 1 From the Main Menu enter the GRPH TBL Mode 2 Make V Window settings Execution 3 Specify the function type and input the function The following is the syntax for function input Function Start Point End Point 4 Draw the graph 5 2 5 Controlling What Appears on a Graph Screen ...

Page 13: ... Use the following V Window settings Xmin 3 Xmax 5 Xscale 1 Ymin 10 Ymax 30 Yscale 5 Procedure 1 m GRPH TBL 2 K V Window dwfwbwc bawdawfwi 3 3 TYPE b Y vx dv c c e w 4 5 DRAW Result Screen You can specify a range when graphing rectangular expressions polar expressions parametric functions and inequalities ...

Page 14: ... opera tion h Square Graph correction V Window x axis values are corrected so they are identical to the y axis values i Rnd Coordinate rounding Rounds the coordinate values at the current pointer location j Intg Integer Each dot is given a width of 1 which makes coordinate values integers v Pre Previous V Window parameters are returned to what they were prior to the last zoom operation l QUICK Qui...

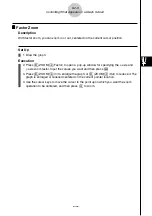
Page 15: ...ot be on a straight line vertically or horizontally from each other Example Graph y x 5 x 4 x 3 and then perform a box zoom Use the following V Window settings Xmin 8 Xmax 8 Xscale 2 Ymin 4 Ymax 2 Yscale 1 Procedure 1 m GRPH TBL K V Window iwiwcwc ewcwbwi 3 TYPE b Y v f v e v d w 5 DRAW 2 2 ZOOM b Box 3 d dw 4 d d f fw Result Screen ...

Page 16: ...ess 2 ZOOM c Factor to open a pop up window for specifying the x axis and y axis zoom factor Input the values you want and then press i 3 Press 2 ZOOM d In to enlarge the graph or 2 ZOOM e Out to reduce it The graph is enlarged or reduced centered on the current pointer location 4 Use the cursor keys to move the cursor to the point upon which you want the zoom operation to be centered and then pre...

Page 17: ... to see if they are tangent Y1 x 4 x 1 x 3 Y2 3x 22 Use the following V Window settings Xmin 8 Xmax 8 Xscale 1 Ymin 30 Ymax 30 Yscale 5 Procedure 1 m GRPH TBL K V Window iwiwbwc dawdawfwi 3 TYPE b Y v e v b v d w dv ccw 5 DRAW 2 2 ZOOM c Factor fwfwi 3 2 ZOOM d In 4 f f d dw Result Screen You can repeat factor zoom to enlarge or reduce a graph even further ...
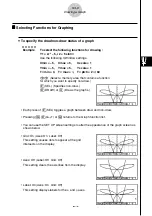
Page 18: ...ssible to view part of a graph hidden behind it When you are using the trace function or other functions during which the function menu is normally not displayed you can turn on the menu display to execute a menu command 5 2 11 Controlling What Appears on a Graph Screen If a pull up menu is open when you press u a to turn off menu display the pull up menu remains on the screen 20011101 ...

Page 19: ...indow 5 2 12 Controlling What Appears on a Graph Screen After using the Calc Window to change the value of a variable connected with a graph or table be sure to always execute Re G re graph or Re T re calculate table Doing so ensures that the displayed graph or table is current Calc Window cannot be used in the RUN MAT Mode while a program is running or in combination with Dynamic Graph Calc Windo...

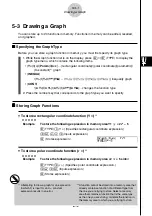
Page 20: ...ecify k k k k k Storing Graph Functions u To store a rectangular coordinate function Y 2 Example To store the following expression in memory area Y1 y 2x2 5 3 TYPE b Y Specifies rectangular coordinate expression cvx f Inputs expression w Stores expression u To store a polar coordinate function r 2 Example To store the following expression in memory area r2 r 5 sin3θ 3 TYPE c r Specifies polar coor...

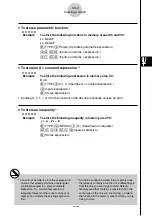
Page 21: ...re an inequality 2 Example To store the following inequality in memory areaY5 y x2 2x 6 3 TYPE f INEQUA b Y Specifies an inequality vx cv g Inputs expression w Stores expression 1You will not be able to store the expression in an area that already contains a rectangular coordinate expression polar coordinate expression X constant expression or inequality Select another area to store your expressio...

Page 22: ...w A composite function can consist of up to five functions u To assign values to the coefficients and variables of a graph function After you combine functions or equations into a composite function you can assign values to the coefficients and variables of the expression and draw a graph Example Assign the values 1 0 and 1 to the expression Y AX2 1 which is in memory area A 3 TYPE b Y av A vx bw ...

Page 23: ...uses one of the default variables listed below Note that the default variable used depends on the memory area type where you are storing the graph function Memory Area Type Default Variable Yn X rn θ Xtn T Ytn T fn X Example Y1 3 and Y1 X 3 are identical values You can also use Dynamic Graph for a look at how changes in coefficients alter the appearance of a graph See 5 8 Dynamic Graphing for more...

Page 24: ...you want to change to Example To change the function in memory area Y1 from y 2x2 3 to y 2x2 3 3 TYPE g CONV d Y Changes the function type to Y u To delete a function 1 While the Graph function list is on the display press f or c to move the highlighting to the area that contains the function you want to delete 2 Press 2 DEL or D 3 Press w Yes to delete the function or i No to abort the procedure ...

Page 25: ... to specify non draw 1 SEL Specifies non draw 5 DRAW or w Draws the graphs Each press of 1 SEL toggles a graph between draw and non draw Pressing u5 G T or i returns to the Graph function list You can use the SET UP screen settings to alter the appearance of the graph screen as shown below Grid On Axes On Label Off This setting causes dots to appear at the grid intersects on the display Axes Off L...

Page 26: ... graph function and then press w Pressing bw stores the graph function to Graph Memory 1 G Mem1 There are 20 graph memories numbered G Mem1 to G Mem20 u To recall a graph function 1 Press 4 GMEM c Recall to display the pop up window 2 Press a number key to specify the Graph memory for the function you want to recall and then press w Pressing bw recalls the graph function in Graph Memory 1 G Mem1 5...

Page 27: ...ure function to Picture Memory 1 Pict 1 There are 20 picture memories numbered Pict 1 to Pict 20 u To recall a stored graph 1 After graphing in GRPH TBL Mode press 6 g 1 PICT c Recall to display the pop up window 2 Press a number key to specify the Picture memory for the picture you want to recall and then press w Pressing bw recalls the picture function in Picture Memory 1 Pict 1 5 4 1 Storing a ...

Page 28: ...drawn from a function u u u u u Sub screen The graph on the sub screen is produced by copying or zooming the main screen graph You can even make different V Window settings for the sub screen and main screen Set Up 1 From the Main Menu enter the GRPH TBL Mode 2 On the SET UP screen select G G for Dual Screen 3 Make V Window settings for the main screen Press 6 RIGHT to display the sub graph settin...

Page 29: ...creen Xmin 2 Xmax 2 Xscale 0 5 Ymin 2 Ymax 2 Yscale 1 Sub screen Xmin 4 Xmax 4 Xscale 1 Ymin 3 Ymax 3 Yscale 1 Procedure 1 m GRPH TBL 2 u3 SET UP ccc2 G G i 3 K V Window cwcwa fwc cwcwbw 6 RIGHT ewewbwc dwdwbwi 4 3 TYPE b Y v v b v b w 5 DRAW 5 6 g 4 COPY Result Screen 5 5 2 Drawing Two Graphs on the Same Screen ...

Page 30: ... to display the sub graph settings screen Pressing 6 LEFT returns to the main screen setting screen Execution 4 Store the functions for the main screen and sub screen 5 Select the function of the graph that you want to eventually have in the sub screen 6 Draw the graph in the main screen 7 Swap the main screen and sub screen contents 8 Return to the function screen 9 Select the function of the nex...

Page 31: ...Xmax 4 Xscale 1 Ymin 5 Ymax 5 Yscale 1 Sub screen Xmin 2 Xmax 2 Xscale 0 5 Ymin 2 Ymax 2 Yscale 1 Procedure 1 m GRPH TBL 2 u3 SET UP ccc2 G G i 3 K V Window ewewbwc fwfwbw 6 RIGHT cwcwa fwc cwcwbwi 4 3 TYPE b Y v v b v b w cvx dw 5 ff1 SEL 6 5 DRAW 7 6 g 5 SWAP 8 i 9 1 SEL 0 5 DRAW Result Screen 5 5 4 Drawing Two Graphs on the Same Screen ...
Page 32: ...t to the sub screen Set Up 1 From the Main Menu enter the GRPH TBL Mode 2 On the SET UP screen select G G for Dual Screen 3 Make V Window settings for the main screen Execution 4 Input the function and draw the graph in the main screen 5 Use Zoom to enlarge the graph and then move it to the sub screen 5 5 5 Drawing Two Graphs on the Same Screen ...

Page 33: ... it Use the following V Window settings Main Screen Xmin 2 Xmax 2 Xscale 0 5 Ymin 2 Ymax 2 Yscale 1 Procedure 1 m GRPH TBL 2 u3 SET UP ccc2 G G i 3 K V Window cwcwa fwc cwcwbwi 4 3 TYPE b Y v v b v b w 5 DRAW 5 2 ZOOM b BOX c ce ew f fd dw Result Screen 5 5 6 Drawing Two Graphs on the Same Screen ...

Page 34: ...raph Description Inputting the Graph command in the RUN MAT Mode enables drawing of rectangular coordinate graphs Set Up 1 From the Main Menu enter the RUN MAT Mode 2 Make V Window settings Execution 3 Input the commands for drawing the rectangular coordinate graph 4 Input the function ...

Page 35: ...le Graph y 2x2 3x 4 Use the following V Window settings Xmin 5 Xmax 5 Xscale 2 Ymin 10 Ymax 10 Yscale 5 Procedure 1 m RUN MAT 2 K V Window fwfwcwc bawbawfwi 3 K6 g 6 g 2 SKTCH b Cls w 2 SKTCH e GRAPH b Y 4 cvx dv ew Result Screen 19991201 ...

Page 36: ...aphing of functions produced by an integration calculation The calculation result is shown in the lower left of the display and the calculation range is blackened in the graph Set Up 1 From the Main Menu enter the RUN MAT Mode 2 Make V Window settings Execution 3 Input graph commands for the integration graph 4 Input the function ...

Page 37: ...tegration x 2 x 1 x 3 dx Use the following V Window settings Xmin 4 Xmax 4 Xscale 1 Ymin 8 Ymax 12 Yscale 5 Procedure 1 m RUN MAT 2 K V Window ewewbwc iwbcwfwi 3 K6 g 6 g 2 SKTCH b Cls w 2 SKTCH e GRAPH c dx 4 v c v b v d c bw Result Screen 1 2 20011101 ...
Page 38: ...to a variable contained in an expres sion and overwrite the resulting graphs on the screen Set Up 1 From the Main Menu Enter GRPH TBL Mode 2 Make V Window settings Execution 3 Specify the function type and input the function The following is the syntax for function input Expression containing one variable variable value value value 4 Draw the graph ...

Page 39: ...w 4 5 DRAW Result Screen The value of only one of the variables in the expression can change Any of the following cannot be used for the variable name X Y r θ T You cannot assign a variable to the variable inside the function When Simul Graph is turned on all of the graphs for the specified variable values are drawn simultaneously Overwrite can be used when graphing rectangular expressions polar e...

Page 40: ... method With this method you specify the conditions for the change in value of the variable List With this method the data in the list you specify is substituted for the x variable to generate a number table u To generate a table using a table range Example To generate a table as the value of variable x changes from 3 to 3 in increments of 1 6 g 2 RANG dwdwbw The numeric table range defines the co...

Page 41: ...item of the SET UP screen uGenerating a Table Example To generate a table of values for the functions stored in memory areas Y1 and Y3 of the Graph function list Use f and c to move the highlighting to the function you want to select for table genera tion and press 1 SEL to select it The sign of selected functions is highlighted on the screen To deselect a function move the cursor to it and press ...

Page 42: ...ting of SET UP screen s Derivative item to On causes a number table that includes the derivative to be displayed whenever you generate a number table uSpecifying the function type You can specify a function as being one of three types 2 Rectangular coordinate Y Polar coordinate r Parametric Param 1 Press 3 TYPE while the function list is on the screen 2 Press the number key that corresponds to the...

Page 43: ...move the cursor to the location of the change eeeeeDf w 6 g 5 TABL The Function Link Feature automatically reflects any changes you make to functions in the GRPH TBL Mode list and DYNA Mode list u To delete a function 1 Use f and c to move the highlighting to the function you want to delete and then press 2 DEL or D 2 Press w Yes to delete the function or i No to abort the operation without deleti...

Page 44: ... A delete table Re T regenerate table from function G CON G PLT connected type draw plot type graph draw R DEL R INS R ADD delete insert add row u To change variable values in a table Example To change the value in Column x Row 3 of the table generated on page 5 7 2 from 1 to 2 5 cc c fw When you change a variable value in Column x all values in the columns to the right are recalculated and displa...

Page 45: ...s uRow Operations u To delete a row Example To delete Row 2 of the table generated on page 5 7 2 c 6 g 1 R DEL u To insert a row Example To insert a new row between Rows 1 and 2 in the table generated on page 5 7 2 c 6 g 2 R INS ...

Page 46: ...Example To add a new row below Row 7 in the table generated on page 5 7 2 cccccc 6 g 3 R ADD uDeleting a Table 1 Display the table and then press 2 DEL A 2 Press w Yes to delete the table or i No to abort the operation without deleting anything ...

Page 47: ...opy the contents of a numeric table column into a list u To copy a table to a list Example To copy the contents of Column x into List 1 K1 LMEM You can select any row of the column you want to copy Input the number of the list you want to copy and then press w bw 5 7 8 Using Tables ...

Page 48: ... settings Execution 3 Store the functions 4 Specify the table range 5 Generate the table 6 Select the graph type and draw it 4 G CON line graph 1 5 G PLT plot type graph 1 2 5 7 9 Using Tables 1 After drawing the graph pressing u 5 G T or i returns to the function storage screen To return to the number table screen press 5 TABL 2 Pressing 6 g 4 G PLT on the function storage screen generates the nu...

Page 49: ...an increment of 1 Y1 3x2 2 Y2 x2 Use the following V Window settings Xmin 0 Xmax 6 Xscale 1 Ymin 2 Ymax 10 Yscale 2 Procedure 1 m GRPH TBL 2 K V Window awgwbwc cwbawcwi 3 3 TYPE b Y dvx cw vxw 4 6 g 2 RANG dwdwbwi 5 5 TABL 6 4 G CON Result Screen 5 7 10 Using Tables You can use Trace Zoom or Sketch after drawing a graph 20011101 ...

Page 50: ...ble range when calculating scatter data from a function Set Up 1 From the Main Menu enter the GRPH TBL Mode Execution 2 Store the functions 3 Specify the table range 4 Select the functions for which you want to generate a table The sign of selected functions is highlighted on the screen 5 Generate the table 5 7 11 Using Tables ...

Page 51: ...2 x 4 Y3 x2 Procedure 1 m GRPH TBL 2 3 TYPE b Y dvx cw v ew vxw 3 6 g 2 RANG dwdwbwi 4 ff1 SEL 5 5 TABL Result Screen 5 7 12 Using Tables You can generate number tables from rectangular coordinate polar coordinate and parametric functions You can include derivatives in generated number tables by specifying On for the Derivative item on the SET UP screen 20011101 ...

Page 52: ...e GRPH TBL Mode 2 Make V Window settings 3 On the SET UP screen select T G for Dual Screen Execution 4 Input the function 5 Specify the table range 6 The number table is displayed in the sub screen on the right 7 Specify the graph type and draw the graph 4 G CON line graph 5 G PLT plot type graph 1 5 7 13 Using Tables 1 Pressing 6 g 4 G PLT on the function storage screen generates the number table...

Page 53: ... a table range of 3 to 3 with an increment of 1 Use the following V Window settings Xmin 0 Xmax 6 Xscale 1 Ymin 2 Ymax 10 Yscale 2 Procedure 1 m GRPH TBL 2 K V Window awgwbwc cwbawcwi 3 u3 SET UP ccc1 T G i 4 3 TYPE b Y dvx cw 5 6 g 2 RANG dwdwbwi 6 5 TABL 7 4 G CON Result Screen 5 7 14 Using Tables 20011101 ...

Page 54: ...een select the Dual Screen item and change its setting to T G Execution 3 Input the function of the graph and make the required table range settings 4 With the number table on the right side of the display draw the graph on the left side 4 G CON connect type graph 5 G PLT plot type graph 5 Turn on G Link 6 Now when you use c and f to move the highlighting among the cells in the table the pointer j...

Page 55: ...t type graph Use a table range of 2 through 9 with an increment of 1 Use the following V Window settings Xmin 1 Xmax 10 Xscale 1 Ymin 1 Ymax 4 Yscale 1 Procedure 1 m GRPH TBL 2 K V Window bwbawbwc bwewbwi u3 SET UP ccc1 T G i 3 3 TYPE b Y dlvw 6 g 2 RANG cwjwbwi 4 5 TABL 5 G PLT 5 6 g 4 G Link 6 c c f f Result Screen ...

Page 56: ... 5 Input values for coefficients and specify which coefficient will be the dynamic vari able 2 6 Specify the start value end value and increment 7 Specify the drawing speed 3 SPEED 1 Pause after each draw Stop Go 2 Half normal speed Slow 3 Normal speed Normal 4 Twice normal speed Fast 8 Draw the Dynamic Graph 5 8 1 Dynamic Graphing 1 The following are the seven built in function types Y AX B Y A X...

Page 57: ...Graph is drawn 10 times Use the following V Window settings Xmin 6 3 Xmax 6 3 Xscale 1 Ymin 3 1 Ymax 3 1 Yscale 1 initial defaults Procedure 1 m DYNA 2 K V Window 1 INIT i 3 u3 SET UP 2 Stop i 4 6 g 3 B IN c1 SEL 5 6 g 4 VAR cwbw bw 6 2 RANG cwfwbwi 7 3 SPEED 3 i 8 6 DYNA Result Screen 5 8 2 Dynamic Graphing 1 4 2 3 Repeats from 1 through 4 ...

Page 58: ...e V Window settings Execution 3 On the SET UP screen specify Stop for Dynamic Type and Deg for Angle 4 Specify Param parametric function as the function type and input a function that contains a dynamic variable 5 Specify the dynamic coefficient 6 Specify the start value end value and increment 7 Specify Normal for the draw speed 8 Start the Dynamic Graph operation 5 8 3 Dynamic Graphing ...

Page 59: ...t an initial velocity of 20 meters per second at horizontal angles of 30 45 and 60 degrees Angle Deg Use the following V Window settings Xmin 1 Xmax 42 Xscale 5 Ymin 1 Ymax 16 Yscale 2 Tθmin 0 Tθmax 6 Tθ ptch 0 1 Procedure 1 m DYNA 2 K V Window bwecwfwc bwbgwcw awgwa bwi 3 u3 SET UP 2 Stop cccc1 Deg i 4 3 TYPE d Param cacav A vw casav A v e jvxw 5 4 VAR 6 2 RANG dawgawbfwi 7 3 SPEED 3 i 8 6 DYNA R...

Page 60: ...peed adjustment menu Each step of the Dynamic Graph draw operation is performed each time you press w slow 1 2 speed normal default speed fast double speed STO stores graph conditions and screen data in Dynamic Graph memory 2 Press the function key 1 to 4 that corresponds to the speed you want to change to 5 8 5 Dynamic Graphing To clear the speed adjustment menu without changing anything press w ...

Page 61: ...u u u To save data in Dynamic Graph memory 1 While a Dynamic Graph draw operation is being performed press A to change to the speed adjustment menu 2 Press 5 STO In response to the confirmation dialog that appears press w Yes to save the data u u u u u To recall data from Dynamic Graph memory 1 Display the Dynamic Graph function list 2 Press 6 RCL to recall all the data stored in Dynamic Graph mem...

Page 62: ... recursion composed of an 2 an 1 an n Set Up 1 From the Main Menu enter the RECUR Mode Execution 2 Specify the recursion type 3 TYPE b an general term of sequence an c an 1 linear two term recursion d an 2 linear three term recursion 3 Input the recursion formula 4 Specify the table range Specify a start point and end point for n If necessary specify a value for the initial term and a pointer star...

Page 63: ...equence as n changes in value from 1 to 6 Procedure 1 m RECUR 2 3 TYPE d an 2 3 4 n an d an 1 2 an w 4 5 RANG 2 a1 bwgwbwbwi 5 6 TABL Result Screen 5 9 2 Graphing a Recursion Formula Specifying On for the Σ Display of the SET UP screen causes the sum of each term to be included in the table The first two values correspond to a1 1 and a2 1 20011101 ...

Page 64: ...enter the RECUR Mode 2 Make V Window settings Execution 3 Specify the recursion formula type and input the formula 4 Specify the table range and start and ending values for n If necessary specify the initial term value and pointer start point 5 Display the recursion formula number table 6 Specify the graph type and draw the graph 5 G CON line graph 6 G PLT plot type graph 5 9 3 Graphing a Recursio...

Page 65: ... 1 as n changes in value from 1 to 6 Use the table values to draw a line graph Use the following V Window settings Xmin 0 Xmax 6 Xscale 1 Ymin 15 Ymax 65 Yscale 5 Procedure 1 m RECUR 2 K V Window awgwbwc bfwgfwfwi 3 3 TYPE c an 1 c2 an bw 4 5 RANG 2 a1 bwgwbwi 5 6 TABL 6 5 G CON Result Screen 5 9 4 Graphing a Recursion Formula ...

Page 66: ...ecify the recursion formula type and input the recursion formula 5 Specify the table range and start and ending values for n If necessary specify the initial term value and pointer start point 6 Display the recursion formula number table 7 Specify the graph type and draw the graph 5 G CON b an Line graph with ordinate an abscissa n c Σan Line graph with ordinate Σan abscissa n 6 G PLT b an Plot ty...

Page 67: ... 1 to 6 Use the table values to draw a plot line graph with ordinate Σan abscissa n Use the following V Window settings Xmin 0 Xmax 6 Xscale 1 Ymin 15 Ymax 65 Yscale 5 Procedure 1 m RECUR 2 u3 SET UP 1 On i 3 K V Window awgwbwc bfwgfwfwi 4 3 TYPE c an 1 c2 an bw 5 5 RANG 2 a1 bwgwbwi 6 6 TABL 7 6 G PLT c Σan Result Screen 5 9 6 Graphing a Recursion Formula ...

Page 68: ...formula 4 Specify the table range n start and end points initial term value and pointer start point 5 Display the recursion formula number table 6 Draw the graph 7 Press w and the pointer appears at the start point you specified Press w several times If convergence exists lines that resemble a spider web are drawn on the display Failure of the web lines to appear indicates either divergence or tha...

Page 69: ...gs Table Range Start 0 End 6 a0 0 01 anStr 0 01 b0 0 11 bnStr 0 11 V Window Settings Xmin 0 Xmax 1 Xscale 1 Ymin 0 Ymax 1 Yscale 1 Procedure 1 m RECUR 2 K V Window awbwbwc awbwbwi 3 3 TYPE c an 1 d2 an x d2 an w d3 bn a cw 4 5 RANG 1 a0 awgwa abwa bbwc a abwa bbwi 5 6 TABL 6 4 WEB 7 1 TRACE w w an is convergence cw w bn is divergence Result Screen 5 9 8 Graphing a Recursion Formula ...

Page 70: ... Tangent line h Normal Line normal to a curve i Invrse Inverse function 2 j Circle Circle v Vert Vertical line l Horz Horizontal line 3 Use the cursor keys to move the pointer to the location where you want to draw and press w 3 1 The above shows the function menu that appears in the GRPH TBL Mode Menu items may differ somewhat in other modes 2 In the case of an inverse function graph drawing star...

Page 71: ... Window settings Xmin 5 Xmax 5 Xscale 1 Ymin 5 Ymax 5 Yscale 1 Procedure 1 m GRPH TBL K V Window fwfwbwc fwfwbwi 3 TYPE b Y v v c v c w 5 DRAW 2 3 SKTCH g Tangnt 3 e ew 1 Result Screen 5 10 2 Changing the Appearance of a Graph 1 You can draw a tangent line in succession by moving the pointer and pressing w ...

Page 72: ...and a pointer appears in the center of the display 3 Use the cursor keys to move the pointer to the location where you want the text to be and input the text 5 10 3 Changing the Appearance of a Graph You can input any of the following characters as comment text A Z r θ space 0 9 EXP π Ans comma x2 log In x 10x ex 3 x 1 sin cos tan sin 1 cos 1 tan 1 i List Mat ...

Page 73: ...e following V Window settings Xmin 5 Xmax 5 Xscale 1 Ymin 5 Ymax 5 Yscale 1 Procedure 1 m GRPH TBL K V Window fwfwbwc fwfwbwi 3 TYPE b Y v v c v c w 5 DRAW 2 3 SKTCH e Text 3 f f d d a Y v v c v c i Result Screen 5 10 4 Changing the Appearance of a Graph 19991201 ...

Page 74: ...appears in the center of the screen 3 Use the cursor keys to move the pointer to the point from which you want to start drawing and then press w 4 Use the cursor keys to move the pointer A line is drawn wherever you move the pointer To stop the line press w Repeat step 3 and 4 to draw other lines After you are finished drawing press i 5 10 5 Changing the Appearance of a Graph ...

Page 75: ... the following V Window settings Xmin 5 Xmax 5 Xscale 1 Ymin 5 Ymax 5 Yscale 1 Procedure 1 m GRPH TBL K V Window fwfwbwc fwfwbwi 3 TYPE b Y v v c v c w 5 DRAW 2 3 SKTCH f Pen 3 f f d dw 4 cd e e ef d dw Result Screen 5 10 6 Changing the Appearance of a Graph 19991201 ...

Page 76: ...y picture memory area Pict 1 through Pict 20 as the Background item When you do the contents of the corresponding memory area is used as the background of the graph screen Example 1 With the circle graph X2 Y2 1 as the background use Dynamic Graph to graph Y X2 A as variable A changes value from 1 to 1 in increments of 1 Recall the background graph X2 Y2 1 ...

Page 77: ...19990401 5 10 8 Changing the Appearance of a Graph Draw the dynamic graph Y X2 1 Y X2 Y X2 1 See 5 8 1 Dynamic Graphing for details on using the Dynamic Graph feature ...

Page 78: ... on the display press f and c to move between them along the x axis of the current pointer location 4 You can also move the pointer by pressing v to display the pop up window and then inputting coordinates The pop up window appears even when you input coordinates directly To exit a trace operation press i 1The pointer is not visible on the graph when it is located at a point outside the graph disp...

Page 79: ... Xmin 5 Xmax 5 Xscale 1 Ymin 10 Ymax 10 Yscale 2 Procedure 1 m GRPH TBL K V Window fwfwbwc bawbawcwi 3 TYPE b Y vx dw 5 DRAW 2 1 TRACE 3 d d 4 bw Result Screen 5 11 2 Function Analysis The following shows how coordinates are displayed for each function type Polar Coordinate Graph Parametric Graph Inequality Graph 19991201 ...

Page 80: ...The current coordinates and the derivative also appear on the display at this time 4 Use d and e to move the pointer along the graph to the point at which you want to display the derivative When there are multiple graphs on the display press f and c to move between them along the x axis of the current pointer location 5 You can also move the pointer by pressing v to display the pop up window and t...

Page 81: ...ction shown below Y1 x2 3 Use the following V Window settings Xmin 5 Xmax 5 Xscale 1 Ymin 10 Ymax 10 Yscale 2 Procedure 1 m GRPH TBL u3 SET UP ccccc1 On i 2 K V Window fwfwbwc bawbawcwi 3 TYPE b Y vx dw 5 DRAW 3 1 TRACE 4 d d 5 bw Result Screen 5 11 4 Function Analysis 19991201 ...

Page 82: ...ET UP screen specify GtoT for Dual Screen 3 Make V Window settings Execution 4 Save the function and draw the graph on the active left screen 5 Activate Trace When there are multiple graphs on the display press f and c to select the graph you want 6 Use d to move the pointer and press w to store coordinates into the number table Repeat this step to store as many values as you want 7 Press 6 CHNG t...

Page 83: ...d store the table contents in List 1 Y1 x2 3 Y2 x 2 Use the following V Window settings Xmin 5 Xmax 5 Xscale 1 Ymin 10 Ymax 10 Yscale 2 Procedure 1 m GRPH TBL 2 u3 SET UP ccc3 GtoT i 3 K V Window fwfwbwc bawbawcwi 4 3 TYPE b Y vx dw v cw 5 DRAW 5 1 TRACE 6 d dwe ewi 7 6 CHNG 8 K1 LMEM bw Result Screen 5 11 6 Function Analysis 20011101 ...

Page 84: ...y Trace Set Up 1 Draw the graph Execution 2 Press 2 ZOOM i Rnd This causes the V Window settings to be changed automatically in accordance with the Rnd value 3 Press 1 TRACE and then use the cursor keys to move the pointer along the graph The coordinates that now appear are rounded 5 11 7 Function Analysis ...

Page 85: ...ction for the two graphs produced by the functions shown below Y1 x2 3 Y2 x 2 Use the following V Window settings Xmin 5 Xmax 5 Xscale 1 Ymin 10 Ymax 10 Yscale 2 Procedure 1 m GRPH TBL K V Window fwfwbwc bawbawcwi 3 TYPE b Y vx dw v cw 5 DRAW 2 2 ZOOM i Rnd 3 1 TRACE d d Result Screen 5 11 8 Function Analysis ...

Page 86: ...dinate for given x coordinate h X Cal x coordinate for given y coordinate i dx Integral value for a given range 3 When there are multiple graphs on the screen the selection cursor k is located at the lowest numbered graph Use the cursor keys to move the cursor to the graph you want to select 4 Press w to select the graph where the cursor is located and display the value produced by the analysis Wh...

Page 87: ...T i 3 TYPE b Y v v c v c w 5 DRAW 2 4 G SLV b Root 4 e e Result Screen 5 11 10 Function Analysis When analyzing a single graph results appear as soon as you select an analysis function in step 2 so step 3 is not necessary Root local maximum value local minimum value and y intercept can be calculated for rectangular coordinate graphs and inequality graphs only The y intercept is the point where the...

Page 88: ...rsor k appears at the lowest numbered graph 3 Use the cursor keys to move the cursor to the graph you want to select 4 Press w to select the first graph which changes the shape of the cursor from k to 쏆 5 Use the cursor keys to move the cursor to the second graph 6 Press w to calculate the point of intersection for the two graphs When an analysis produces multiple values press e to calculate the n...

Page 89: ...ale 1 Ymin 5 Ymax 5 Yscale 1 Procedure 1 m GRPH TBL K V Window fwfwbwc fwfwbwi 3 TYPE b Y v bw vxw 5 DRAW 2 4 G SLV f Isect 6 e Result Screen 5 11 12 Function Analysis In the case of two graphs the point of intersection is calculated immediately after you press 4f in step 2 You can calculate the point of intersection for rectangular coordinate graphs and inequality graphs only ...

Page 90: ...ction you want to perform When there are multiple graphs the selection cursor k appears at the lowest numbered graph 4 G SLV g Y Cal y coordinate for given x h X Cal x coordinate for given y 3 Use fc to move the cursor k to the graph you want and then press w to select it 4 Input the given x coordinate value or y coordinate value Press w to calculate the corresponding y coordinate value or x coord...

Page 91: ...b Y v bw v v c v c w 5 DRAW 2 4 G SLV g Y Cal 2 4 G SLV h X Cal 3 cw 3 cw 4 a fw 4 c cw Result Screen 5 11 14 Function Analysis When there are multiple results for the above procedure press e to calculate the next value Pressing d returns to the previous value Step 3 of the above procedure is skipped when there is only one graph on the display The X Cal value cannot be obtained for a parametric fu...

Page 92: ...and then press w You can also move the pointer by pressing v to display the pop up window and then inputting coordinates 5 Use e to move the upper limit pointer to the location you want You can also move the pointer by pressing v to display the pop up window and then inputting the upper limit and lower limit values for the integration range 6 Press w to calculate the integral value 5 11 15 Functio...

Page 93: ...alue at 2 0 Y1 x x 2 x 2 Use the following V Window settings Xmin 6 3 Xmax 6 3 Xscale 1 Ymin 4 Ymax 4 Yscale 1 Procedure 1 m GRPH TBL K V Window g dwg dwbwc ewewbwi 3 TYPE b Y v v c v c w 5 DRAW 2 4 G SLV i dx 4 d dw 5 e e Upper limit x 0 6 w Result Screen 5 11 16 Function Analysis ...

Page 94: ... Vertex Length e focus vertex latus rectum eccentricity Dirtrx Sym directrix axis of symmetry X Icpt Y Icpt x intercept y intercept u Circular Graph Analysis Center Radius center radius X Icpt Y Icpt x intercept y intercept u Elliptical Graph Analysis Focus Vertex Center e focus vertex center eccentricity X Icpt Y Icpt x intercept y intercept u Hyperbolic Graph Analysis Focus Vertex Center e focus...

Page 95: ... Yscale 1 4 G SLV b Focus Calculates the focus i 4 G SLV d Vertex Calculates the vertex i 4 G SLV f Length Calculates the latus rectum When calculating two foci for an ellipse or hyperbolic graph press e to calculate the second focus Pressing d returns to the first focus When calculating two vertexes for an ellipse or hyperbolic graph press e to calculate the second vertex Pressing d returns to th...

Page 96: ... 1 Ymin 3 1 Ymax 3 1 Yscale 1 4 G SLV b Center Calculates the center i 4 G SLV c Radius Calculates the radius u To calculate the x and y intercepts G SLV X Icpt Y Icpt Example To determine the x and y intercepts for the hyperbola X 3 2 Y 1 2 1 22 22 Use the following V Window settings Xmin 4 Xmax 8 Xscale 1 Ymin 5 Ymax 5 Yscale 1 4 G SLV g X Icpt Calculates the x intercept 5 11 19 Function Analysi...

Page 97: ...cepts u To draw and analyze the axis of symmetry and directrix G SLV Sym Dirtrx Example To draw the axis of symmetry and directrix for the parabola X 2 Y 1 2 1 Use the following V Window settings Xmin 6 3 Xmax 6 3 Xscale 1 Ymin 3 1 Ymax 3 1 Yscale 1 4 G SLV e Sym Draws the axis of symmetry i 4 G SLV c Dirtrx Draws the directrix 5 11 20 Function Analysis ...

Page 98: ...2 2 1 42 22 Use the following V Window settings Xmin 3 Xmax 7 Xscale 1 Ymin 1 Ymax 5 Yscale 1 4 G SLV e e Calculates eccentricity 5 11 21 Function Analysis Certain V Window parameters can produce errors in values produced as graph analysis results The message Not Found appears on the display when graph analysis is unable to produce a result The following can result in inaccurate analysis results o...

Reviews: