


16 | QX200 Droplet Reader and QuantaSoft Software Instruction Manual
QX200 Droplet Reader and QuantaSoft Software Instruction Manual | 17
Chapter 3 Using QuantaSoft Software
3.3.1 Viewing Channel Data
Click
1D Amplitude
to visualize the data collected from each channel of selected wells. Use the radio buttons
to select the channels to be displayed. This tab also provides options for adjusting the thresholds used in
assigning positives and negatives for each channel.
When viewing a single well, change the threshold using one of the following options:
■
■
Use the single-well threshold tool
. The assigned threshold appears as a horizontal pink line
-Or-
■
■
Enter threshold values in the Set Threshold field
When viewing multiple wells, change the thresholds as follows:
■
■
Use the single-well threshold tool
to change the threshold in a single well. Vertical yellow lines in the
processed data plots show where droplet data from each well start and end, and the assigned threshold
appears as a horizontal pink line
■
■
Use the multi-well threshold tool
to change the threshold in all the wells (appears as a pink line in the plots)
■
■
To manually set threshold values for single or multiple wells, enter the values in the Set Threshold field below
the plot and click
Set Threshold
or
Enter
Tip:
It is recommended that researchers review the thresholds set automatically by the software and
make changes as needed.
Click
Auto Analyze
to revert to automatic threshold settings and calculations. Threshold adjustments can also
be made in the 2D Amplitude scatter plots (see Section 3.3.2).
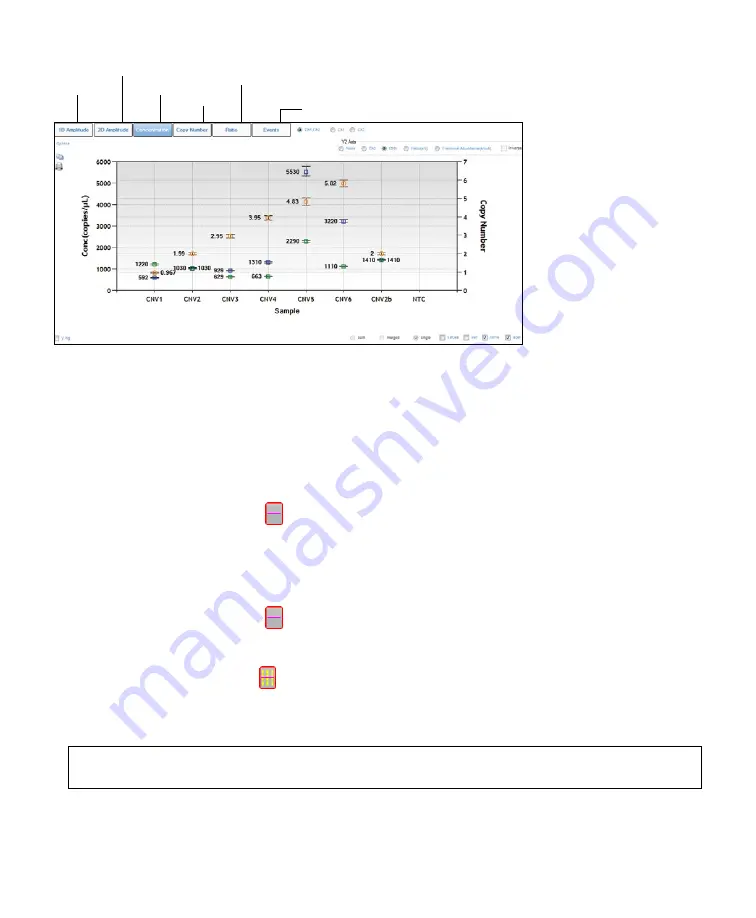
Fig. 16. Graphical data display options.
A concentration plot from a CNV analysis is shown, with display options across the top.
Channel 1 vs. channel 2 scatter plot
Concentration data
Plot of measured copy numbers
Plot of # droplet events counted
Channel data
Plot of ratio of unknown:reference (a/b or a/[a+b])


