push-pull wiring of the coils
“reduces harmonic distortion
induced by the non-linearity of
the magnetic field.”
1
2
3 4 5
6
7
8
S
S
S
N
N
N
N
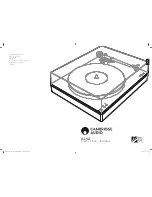
Figure 3.3: The magnetic circuit repre-
sentation of the MMC cartridge, show-
ing the diagonal pair of pole pieces for
one of the two audio channels.
1
2
3 4 5
6
7
8
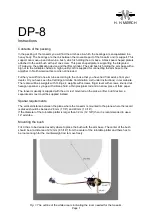
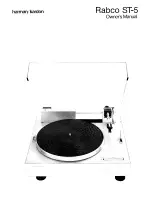
Figure 3.4: The Micro Moving Cross MMC
4000 cartridge design. 1. Nude Pra-
manik diamond, 2. Low mass beryllium
cantilever, 3. Moving micro cross, 4.
Block suspension, 5. Pole pieces (4), 6.
Induction coils, 7. Mu-metal screen, 8.
Hycomax magnet
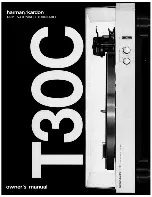
Figure 3.5: Large-scale models of the
MMC cartridges used for past demon-
strations.
3.2 Signal Levels
Every audio device relies on a rather
simple balancing act. The “signal”,
whether it’s speech, music, or sound
e
ff
ects, should be loud enough to mask
the noise that is inherent in the
recording or transmission itself. The
measurement of this “distance” in level
is known as the
Signal-to-Noise Ratio
or
SNR
. However, the signal should not
be so loud as to overload the system
and cause distortion e
ff
ects such as
“clipping”, which results in what is
commonly called
Total Harmonic
Distortion
or
THD
One basic method
to evaluate the quality of an audio
signal or device is to group these two
measurements into one value: the
Total Harmonic Distortion plus Noise
or
THD+N
value. The somewhat
challenging issue with this value is that
a portion of it (the noise floor) is
typically independent of the signal
level, since a device or signal will have
some noise regardless of whether a
signal is present or not. However, the
distortion is typically directly related to
the level of the signal.
In modern digital PCM audio signal
(assuming that they are
correctly-implemented and ignoring
any additional signal processing), the
noise floor is the result of the dither
that is used to randomise the inherent
quantisation error in the encoding
system. This noise is independent of
the signal level, and entirely
dependent on the resolution of the
system (measured in the number of
bits used to encode each sample). The
maximum possible level that can be
encoded without incurring additional
distortion that is inherent in the
encoding system itself is when the
maximum (or minimum) value in the
audio signal reaches the highest
possible signal value of the system.
Any increase in the signal’s level
beyond this will be clipped, and
harmonic distortion artefacts will
result.
Figure
shows two examples of the
relationship between the levels of the
signal and the THD+N in a digital audio
system. The red line shows a 24-bit
encoding, the blue line is for 16-bit.
The “flat line” on the left of the plot is
the result of the noise floor of the
system. In this region, the signal level
is so low, it’s below the noise floor of
the system itself, so the only
measurable output is the noise, and
not the signal. As we move towards
the right, the input signal gets louder
and raises above the noise floor, so the
output level naturally increases as
well. However, in a digital audio
system, we reach a maximum possible
input level of 0 dB FS. If we try to
increase the signal’s level above this,
the signal itself will not get louder,
however, it will become more and
more distorted. As a result, the
distortion artefacts quickly become
almost as loud as the signal itself, and
so the plots drop dramatically.
This is why good recording engineers
typically attempt to align the levels of
the microphones to ensure that the
maximum peak of the entire recording
will just barely reach the maximum
possible level of the digital recording
system. This ensures that they are
keeping above the noise floor as much
as possible without distorting the
signals.
-160
-140
-120
-100
-80
-60
-40
-20
0
Input level (dB)
0
20
40
60
80
100
120
140
Level of Signal relative to Dist Noise (dB)
Figure 3.6: Two examples of the rela-
tionship between the levels of the sig-
nal and the THD+N in a digital audio
system. These are idealised calcula-
tions, assuming TPDF dither in a “per-
fect” LPCM system. The red line shows
a 24-bit encoding, the blue line is for 16-
bit.
Audio signals recorded on
analogue-only devices generally have
the same behaviour; there is a noise
floor that should be avoided and a
3
The assumption here is that the distortion produces harmonics of the signal, which is a simplified view of the truth, but one that is easy to measure.
8