CHAPTER 6 Performance Monitoring
Mediant 800 SBC | SNMP Reference Guide
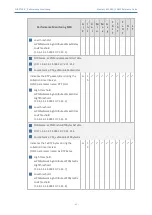
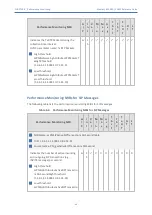
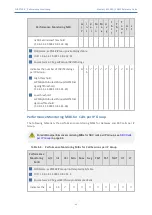
The performance monitoring MIB tables can include the following properties (columns):
■
Table specific index:
This is a table key.
■
Interval:
Indicates the measured interval (0,1, or 2), which is a table key.
■
Val:
Indicates the value of the gauge or counter. This is the snapshot view of the device's
current activity.
●
Counter:
Cumulative value (only increases).
●
Gauge:
Fluctuates in value (increases and decreases).
■
Average:
Indicates the average value within the interval.
■
Max:
Indicates the maximum gauge value during the interval.
■
Min:
Indicates the minimum gauge value during the interval.
■
Volume:
Indicates the number of times the gauge or counter was updated (i.e., the
volume of change), for example:
●
For a trunk utilization element, the volume indicates how many calls were made and
released.
●
For the Ethernet connection status element, the volume indicates how many network
connections and disconnections occurred.
■
Thresholds:
●
TimeBelowLowThreshod:
Indicates the percent (%) of the interval time for which the
gauge was below the low threshold (if defined).
●
TimeAboveHighThreshod:
Indicates the percent (%) of the interval time for which the
gauge was above the high threshold (if defined).
●
TimeBetweenThresholds:
Indicates the percent (%) of the interval time for which the
gauge was between the low and high thresholds (if defined).
The following figure shows an example of how the device calculates thresholds. The purple
bar indicates the time when the element was below the low threshold (about 40% of the
interval time), the blue bar indicates the time when the element was between the low and
high threshold (about 30%), and the red bar indicates the time when the element was
above the high threshold (about 30%).
- 30 -

