background image


Page 44 


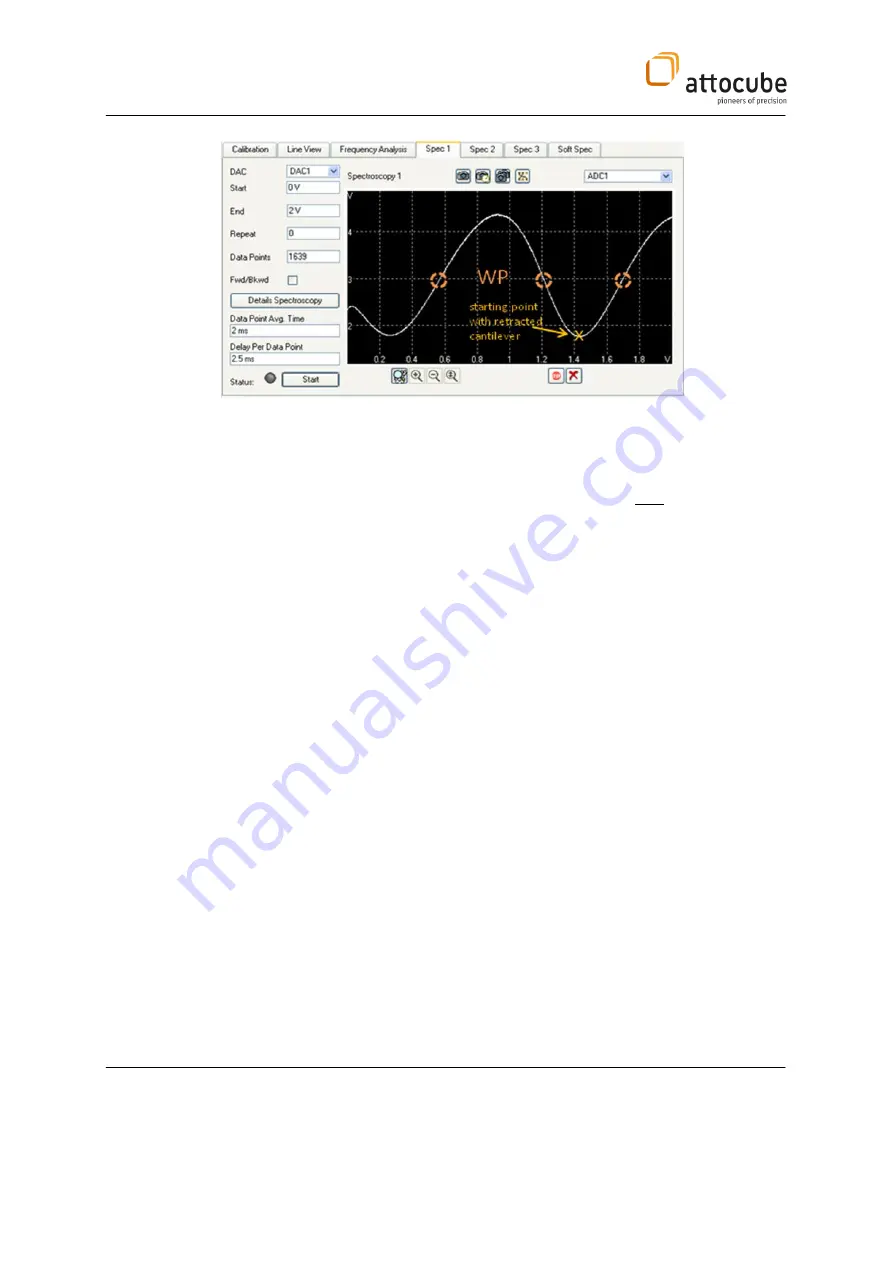
Figure 18:

  Working point WP.


The  fiber-tip  cavity  now  must  be  adjusted  to  a  minimum  (ADC1

min

  )  of  the 

interferogram  by  tuning  the  DC  voltage  of  the  dither  piezo  (normally  on 
DAC1).  Hence,  as  soon  as  the  sample  starts  pushing  against  the  tip  the 
cavity will decrease and the interferometric signal must increase. 


2. Starting the auto approach: 

The auto approach settings must be set accordingly, i.e. the voltage of the 
limiter must be set slightly higher than the minimum of the interferometric 
signal and the stop condition must be set to “ > threshold”. Remember that 
the autoapproach monitors the parameter set kin the feedback window. This 
parameter must be set to the DC signal of the photo-detector (ADC1). 

Examples for correct autoapproach settings are given in the 3 figures below.  


The auto approach will stop when the tip touches the sample. The cantilever 
will be bent and the interference signal will sharply increase, see figure to 
the left 

Summary of Contents for attoAFM I

Page 1: ...croscope attoAFM I MFM KPFM P5788 attocube systems AG K niginstrasse 11 A D 80539 M nchen Germany Phone 49 89 24208888 Fax 49 89 24208890 E Mail info attocube com www attocube com For technical querie...

Page 2: ...ionality or the manual itself at any time without prior notice Furthermore attocube systems assumes no responsibility or liability for any misinformation errors or general inaccuracies that may appear...

Page 3: ...bling the attoAFM I Module 17 III 3 a Inserting removing the stack into from the microscope housing 17 III 3 b Mounting the Scanner Positioner Stack 19 III 4 Sample Exchange and Thermal Contact 19 III...

Page 4: ...ng modules as well as a force detection scheme based on an all fiber low coherence interferometer explained in detail in the next section To perform low temperature microscopy the attoAFM I is cooled...

Page 5: ...erent coatings which is placed before the end of an optical fiber hence forming an optical cavity the length of which can be measured by a laser detector system The sample to be examined is placed in...

Page 6: ...nt Laser safety warning Class 1M laser product Warning Risk of electric shock High voltages present Warning Risk of danger Refer to the handbook for details on this hazard Functional EMC earth ground...

Page 7: ...case of hidden leaks air may enter into vacuum spaces and build up large amounts of condensate at cold walls and interfaces In case such system is warmed up again such ice may evaporate quickly and e...

Page 8: ...t be connected only to an earthed fused supply of 100 115 or 230 V 50 60 Hz Caution In case of failure refer to your local dealer or attocube systems Users are cautioned not to attempt to access open...

Page 9: ...microscope built around an optical fiber based interferometer The sensor is compatible with any commercial cantilever and measures the vertical deflection of the cantilever with picometer resolution...

Page 10: ...s the advantage of eliminating spurious interference signals resulting from other reflections in the setup e g the coupler thus leading to an increase of the signal to noise ratio of about 30 dB Figur...

Page 11: ...the cantilever up until the intensity reaches the middle intensity value The amount of bending corresponds in this case to a cavity length difference of 8 and hence the force on the tip is F 8 k with...

Page 12: ...below the 3He pot The top of the 3He insert contains all electrical connectors and feedthroughs the vacuum window and the fiber feedthrough The AFM module including the fiber and sample positioning un...

Page 13: ...lder is mounted to the very top of the assembly The stack will be delivered completely mounted If you ever need to disassemble and consequently reassemble it please recheck the correct orientation whi...

Page 14: ...technical specifications please refer to the respective manual The axis number is counted from the right to the left For technical specifications please refer to the respective manual Figure 7 ANC300...

Page 15: ...s and the microscope with multi pin Fischer cables For details about the labelling and electrical connections see section IV 1 III 2 c ANC350 Piezo controller for positioners Piezo controller driving...

Page 16: ...M1300 III 2 e ASC500 SPM Controller The modular and flexible digital SPM controller ASC500 combines state of the art hardware with innovative software concepts to offer an unmatched diversity of scann...

Page 17: ...o assemble and align the AFM module Figure 11 The assembled attoAFM I module III 3 a Inserting removing the stack into from the microscope housing The microscope stack is fixed to the housing bottom B...

Page 18: ...e sides of the bottom plate may be used to smoothly lever off the plate using a screw driver Before mounting the stack back into the housing inspect the cabling before pushing the bottom plate upwards...

Page 19: ...te gets between the sample plate and the lower copper body The sample holder may be electrically connected with a single pin connector to set the sample potential In the present setup the pin S is sup...

Page 20: ...Page 20 III 5 Changing the AFM Cantilever...

Page 21: ...change without notice The attoAFM I head includes an alignment free cantilever holder that is compatible with all commercially available XY auto alignment AFM tips In order to change the tip the atto...

Page 22: ...ever holder while the fiber ferrule is still far away from any potentially harmful obstacle 5 Feed the ferrule into the cantilever holder through another guiding sleeve d The ferrule is protected by a...

Page 23: ...or the alignment and adjustment procedures of the cantilever on the AFMI head namely I cantilever exchange stage II AFM head parking site III slider module parking site III 5 b Cantilever exchange In...

Page 24: ...eezers for handling the cantilevers near the alignment chip Metallic parts may easily destroy this silicon chip If the cantilever is not sitting correctly within the chip you may gently push it with t...

Page 25: ...decent interferogram in this context decent is defined by the intensity of the interferometric signal and its symmetric shape If the interferogram becomes comparable to the one depicted in Figure 12 w...

Page 26: ...etracted and that the cantilever cannot touch the sample i e sits clearly above the later Now slide the aligned attoAFM I head into the microscope housing and tighten the two screws on top of the hous...

Page 27: ...SCAN DC in x 1 X scanner Y Out ANC300 SCAN DC in y 2 Y scanner Z Out ANC300 SCAN DC in z 3 Z scanner DAC1 ANC300 SCAN DC in D 4 dither offset DC DAC2 AC DC coupler for KPFM DCin tip voltage DAC3 Sampl...

Page 28: ...3 OUTPUT Z Positioner Pz Sx ANC300 Axis 1 OUTPUT X Scanner Sx Sy ANC300 Axis 2 OUTPUT Y Scanner Sy Sz ANC300 Axis 3 OUTPUT Z Scanner Sz T I temperature monitor Ch A temperature sensor current T V temp...

Page 29: ...rs in the bottom plate of the housing All connectors are labelled with short codes The port numbers are counted from the left to the right 1 2 3 see pictures below Table 3 describes these codes and pr...

Page 30: ...order to get access to the front row pin connections the front side needs to be taken off by opening one screw Front view of the present housing pin connections Back view of the present housing pin c...

Page 31: ...les are labelled 1 2 3 4 IV 2 Fiber Connection The optical read out system of the cantilever of the attoAFM I system requires only one optical connection which will be described in this section For th...

Page 32: ...al is acquired during scanning which can be directly converted into a height signal by using the formula V dV nm V dV dz 246 2 Here V is the peak to peak amplitude of the interferogram dz is the chang...

Page 33: ...ne by the controller software The error signal is the detector signal This mode is suggested for samples with height corrugations 4 Since a feedback always causes low pass filtering the measurements i...

Page 34: ...es around the point of maximum slope of the interference signal working point The working point is set by applying an offset DC voltage to the dither piezo The AC voltage detected peak to peak by the...

Page 35: ...constant K F the relation between the force gradient and the frequency shift f f0 is given by the approximation F 2 f f0 K Thus the magnetic electric information can be either extracted from the dete...

Page 36: ...to manually approach the sample to the tip using the z coarse positioner This should be done under eye inspection to a distance close enough for reasonable auto approach duration but still far enough...

Page 37: ...justed to this point the cantilever must be excited at its resonance frequency and the photo detected AC voltage AFM Aosc will be used as measuring signal for the feedback loop The basic steps for thi...

Page 38: ...of the cantilever The excitation amplitude and all demodulation settings are made in the Lock In widow The frequency sweep is done in the Calibration window High Frequency box Amplitude pp 10 200 mV...

Page 39: ...uency selection tool Press the ok button green checkmark to set the chosen frequency as the excitation frequency It is also possible to zoom in by using the frequency range selection tool It is possib...

Page 40: ...usting Z limit min and Z limit max within the Feedback tap Before starting the auto approach select the AFM_Aosc as Actual Value in the Feedback tab Furthermore choose the following parameters Z out 0...

Page 41: ...nd initial tip sample distance After the auto approach is finished the sample surface is within reach of the z scanner The figure below shows how the auto approach signal is typically reflected in the...

Page 42: ...ps the z spectroscopy before the tip crashes into the sample Active checked Source AFM Aosc Value 0 5 A Limit Source Value The contact point where the signal is dropping sharply should be in the middl...

Page 43: ...o the WP by tuning DAC1 manually but by using ADC1 as the feedback input and defining the working point WP as the setpoint 1 Adjustment of the fiber cantilever cavity length Execute a dither spectrosc...

Page 44: ...ust be set accordingly i e the voltage of the limiter must be set slightly higher than the minimum of the interferometric signal and the stop condition must be set to threshold Remember that the autoa...

Page 45: ...mum z scanner stroke see data sheet at the end of the manual P 1 5 m I 10 50 Hz Setpoint Working point WP as indicated in Figure 18 Inv Polarity not checked signal ADC1 is expected to increase with in...

Page 46: ...the coarse positioning for example Frequency 200 1000Hz Amplitude 30V RT 50V LT 3 Z Spectroscopy After the Auto Approach run a so called z Spectroscopy This is a spectroscopy where the feedback param...

Page 47: ...spectroscopy before the a certain force onto the tip is exceeded Active checked Source ADC1 Value higher than the interference minimum Sign Source Value Start the z Spectroscopy The jump to contact JT...

Page 48: ...sections above Inv Polarity not checked for contact mode signal ADC1 is expected to increase with increasing Z checked for non contact mode signal ADC1 is expected to decrease with increasing Z In the...

Page 49: ...the surface roughness At the same scan speed for example a rougher surface will need a faster feedback loop compared to a smooth surface In addition the sample tilt can be compensated by setting a pro...

Page 50: ...Page 50 attocube systems AG K niginstrasse 11a Rgb D 80539 M nchen Germany Phone 49 89 2877 809 0 Fax 49 89 2877 809 19...

Reviews: