Page 11
© 2001-2015 attocube systems AG. Product and company names listed are trademarks or trade names of their respective
companies. Any rights not expressly granted herein are reserved. ATTENTION: Specifications and technical data are subject
to change without notice.
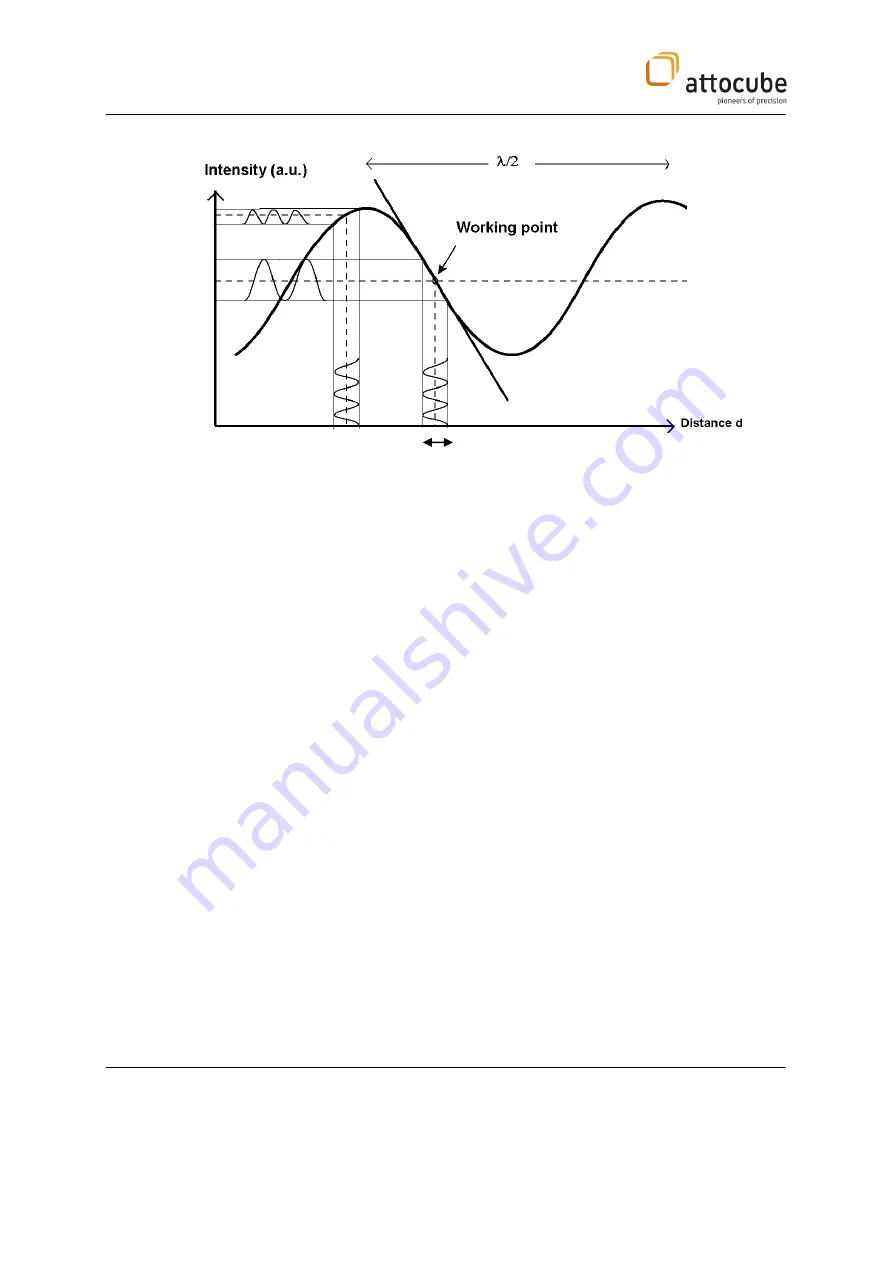
Figure 4
: Schematic drawing of the interference signal.
Contact mode:
The tip is in direct contact with the sample, while the intensity is in the
middle of the intensity range. The cantilever is not oscillating. Due to a de-
tuning of the cantilever position before contacting the surface, a
compressive force is applied onto the sample. The strength of the force
corresponds to the amount of detuning times the force constant of the
cantilever.
For example, the cantilever position can be adjusted off contact such that
the intensity is in a minimum. Now, by engaging the feedback loop, the
sample is lifted up until the tip engages with the sample surface. While still
increasing the sample height, the smaple pushes the cantilever up until
the intensity reaches the middle intensity value. The amount of bending
corresponds in this case to a cavity length difference of
/8, and hence the
force on the tip is
F =
/8*k
, with
k
being the force constant of the
cantilever.
As the feed-back loop keeps the intensity constant, the amount
of bending is kept. Hence, the force on the tip is kept constant.
Non-contact mode:
For non-contact mode, no detuning is applied; the cavity length is such
that the signal is in the middle between the extrema. Then, the cantilever
is excited by the dither piezo at its resonance frequency. The input of the
lock-in measures the AC component of the photo-detected signal, which
reflects the oscillation amplitude of the cantilever. As the cantilever
approaches the sample, the oscillation amplitude drops rapidly with
decreasing tip-sample distance. This signal serves as the input to a feed-
back loop which maintains the cantilever oscillation amplitude at a so
called ‘set level’, which corresponds to a given force between the sample
and the cantilever. During the scan, the output signal of the feedback loop
is recorded (z-scanner piezo voltage), providing a topographic image.
d


