


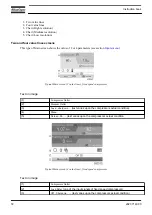

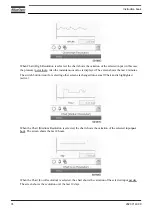


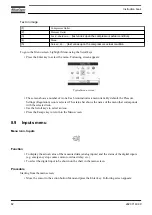


When Chart (High Resolution is selected, the chart shows the variation of the selected input (in this case
the pressure) per minute. Also the instantaneous value is displayed. The screen shows the last 4 minutes.
The switch button (icon) for selecting other screens is changed into a small Chart and is highlighted
(active).
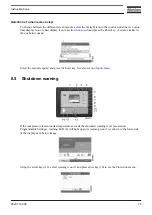
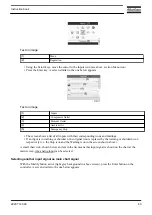
When the Chart (Medium Resolution is selected, the chart shows the variation of the selected input per
hour. The screen shows the last 4 hours.
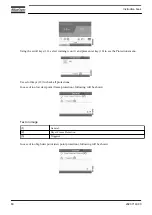
When the Chart (Low Resolution) is selected, the chart shows the variation of the selected input per day.
The screen shows the evolution over the last 10 days.
Instruction book
74
2920 7140 90
Summary of Contents for GA15
Page 1: ...Atlas Copco Oil injected rotary screw compressors GA 15 GA 18 GA 22 GA 26 Instruction book ...
Page 2: ......
Page 168: ......
Page 169: ......


