OUTPUT POWER CURVES
The curves that follow depict the changes for each mode at specific power settings.
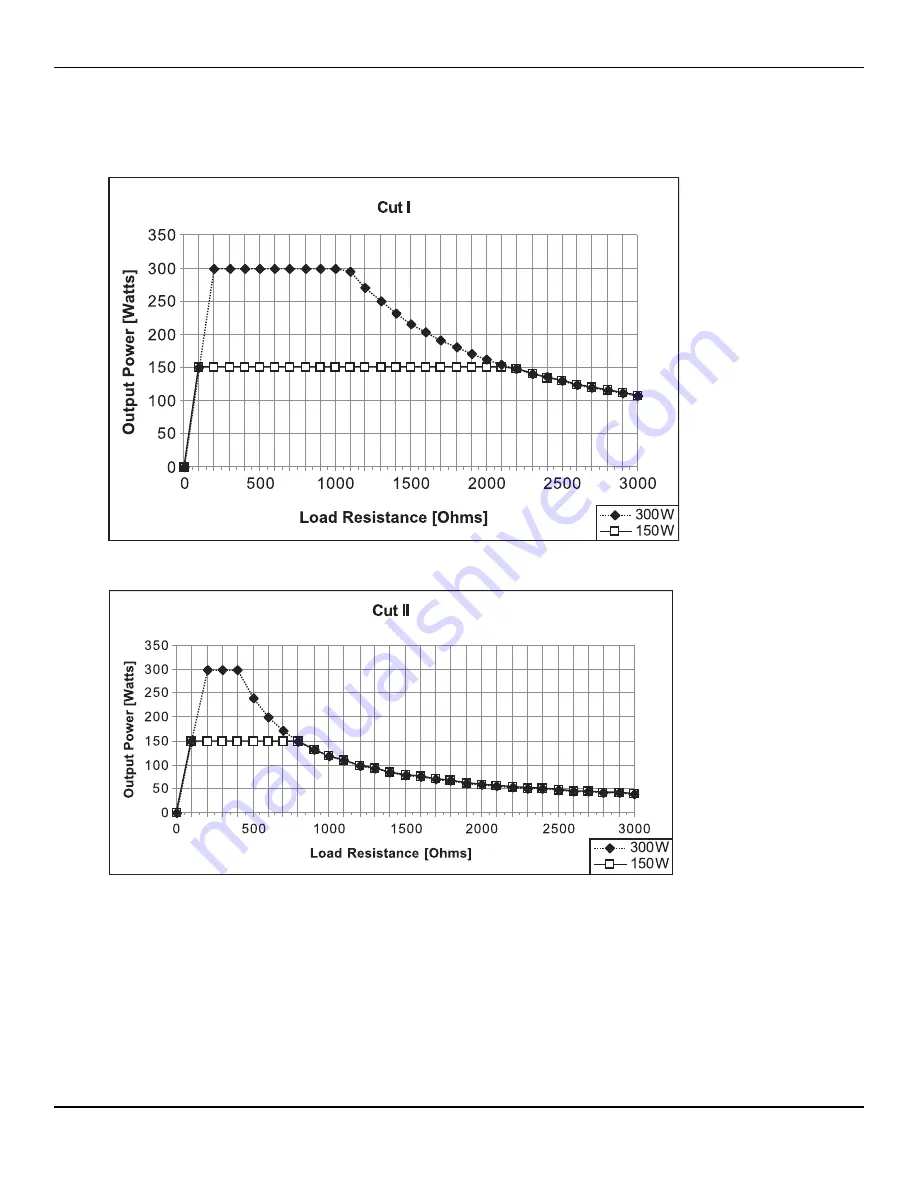
Figure A – 1 Output power vs impedance for Cut I mode
Figure A – 2 Output power vs impedance for Cut II mode
A-5
User ’s Guide • O.P.E.S. Electrosurgical Generator


