


Integration Key
Purpose
Use the Integration function to view a plot of the se-
lected signal over time. Signals include voltage, cur-
rent, frequency, phase and power factor. Configure the
signal sampling interval from 1 to 65535 seconds. The
vertical range scales according to the upper and lower
limits that you configure.
Press
2nd
>
AXIS
to scale the plotted values to
the desired viewing range. This includes the upper
and lower limits, the last measured value, a vertical
graticule and the units of the measured signal. See
next page for setup details.
Procedure
1. Press
2nd
>
to plot and view the configured
signal.
2. Press
and hold for three seconds to restart the
plot.
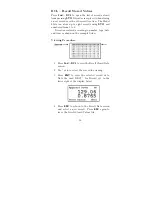
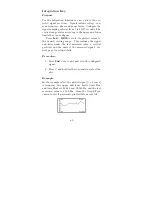
Example
In the example below, the plotted signal (i.e. Source)
is frequency, the upper and lower limits (Axis Max
and Axis Min) are 60.020 and 59.980 Hz, and the last
measured value is 60.00 Hz. Since the Graph Type
chosen is Scroll, previously plotted data moves left.
60
Summary of Contents for 928A
Page 1: ...MODEL 928A USER S MANUAL Arbiter Systems Inc Paso Robles CA 93446 U S A ...
Page 6: ...vi ...
Page 12: ...xii ...
Page 14: ...xiv ...
Page 57: ...Channel B Combined Caution For current probe use see CT Probe Use on page 4 43 ...
Page 112: ...CT Cable Connector Figure 16 CT Cable Connector side view Figure 17 CT Connector End View 98 ...
Page 114: ...100 ...
Page 115: ...CE Mark Certification ...