VISION
ing list. All available data is displayed in a tree diagram, click the arrow symbols to
access individual items.
Confirm your selection by clicking the check symbol in the bottom right corner.
The new element will be displayed in the upper left corner and the configuration
window is displayed. Configure the element as described in the next chapters.
6.4.
6.4.
6.4.
6.4. Editing existing elements
Editing existing elements
Editing existing elements
Editing existing elements
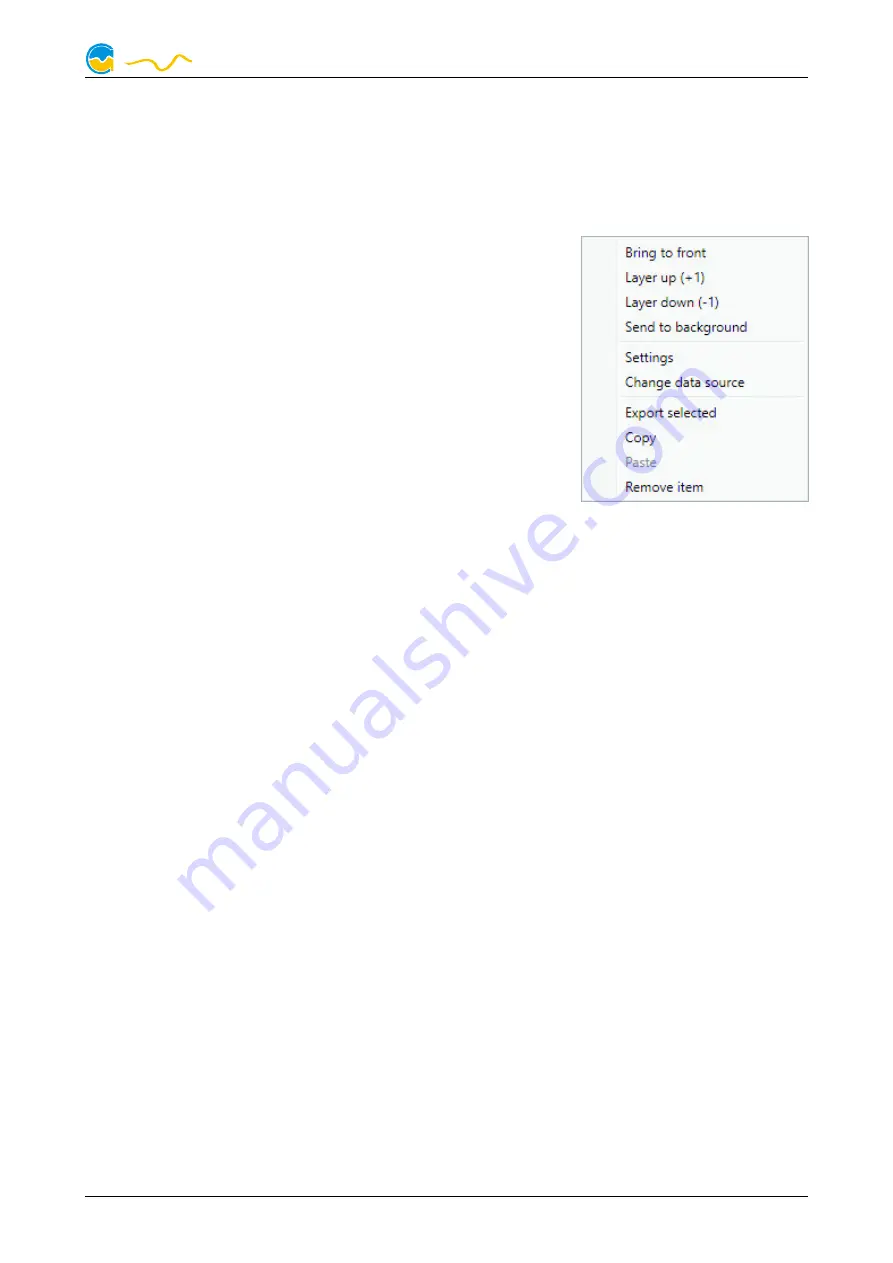
If the currently selected overview page is unlocked for
editing, right-clicking an element will access a context
menu.
To access the settings of an element, select “Settings”
in the context menu or simply double click the element.
If you want to move an element, “drag” this element
while holding down the mouse button. Release the
mouse button when the element is at the desired posi-
tion.
6.5.
6.5.
6.5.
6.5. Values and names
Values and names
Values and names
Values and names
If the currently selected overview page is unlocked for editing, right-click an ele-
ment and select “Settings”. You may also double click the element.
Font face, size and color as well as position, decimal places and unit can be con-
figured for individual values.
6.6.
6.6.
6.6.
6.6. Detailed data elements
Detailed data elements
Detailed data elements
Detailed data elements
If the currently selected overview page is unlocked for editing, right-click an ele-
ment and select “Settings”. You may also double click the element. Apart from po-
sition, size and color, the style of the element can be selected and configured. The
following styles are available:
●
Headline only: Compact display as a headline.
●
Text: Displays the numerical value in a box with a headline.
●
Bar graph: Displays numerical value as well as bar graph.
●
Chart: Displays the value in chronological sequence as a chart.
●
Gauge: Displays the value as a analog gauge.
All display styles offer extensive configuration options, additionally statistical data
such as minimum, maximum and average can be displayed.
6.7.
6.7.
6.7.
6.7. Log data chart
Log data chart
Log data chart
Log data chart
This element can be used to display charts on overview pages. The charts have to
be created using the data log functionality of the aquasuite before they become
available for overview pages. Please refer to the next chapter for details. Once a
chart has been configured, it can be selected from the “Chart selection” list on the
“Display” tab of the settings dialog.
© 2020
Aqua Computer GmbH & Co. KG
- 7 -
Gelliehäuser Str. 1, 37130 Gleichen
computer
aqua


