ANDILOG GYROTORK DUAL Operating Manual Download Page 18


Instruction Manual 

 V6.19 

GYROTORK DUAL version 


- 17 - 


VII.


CALCULATION Settings 

 
The GYROTORK torque gauge allows you to setup automatic calculations derived from the graph. The 
settings of the calculation can be done in the Test menu. It is possible to perform 2 simultaneous 
calculations in addition to raw data, the maximum and the minimum. 
 

1.


Calculation  

 
The GYROTORK allows you to select 2 calculations, derived from the graph. Select the Calculus 1 or 2 
tab. The Test running mode should be activated to perform calculation. 


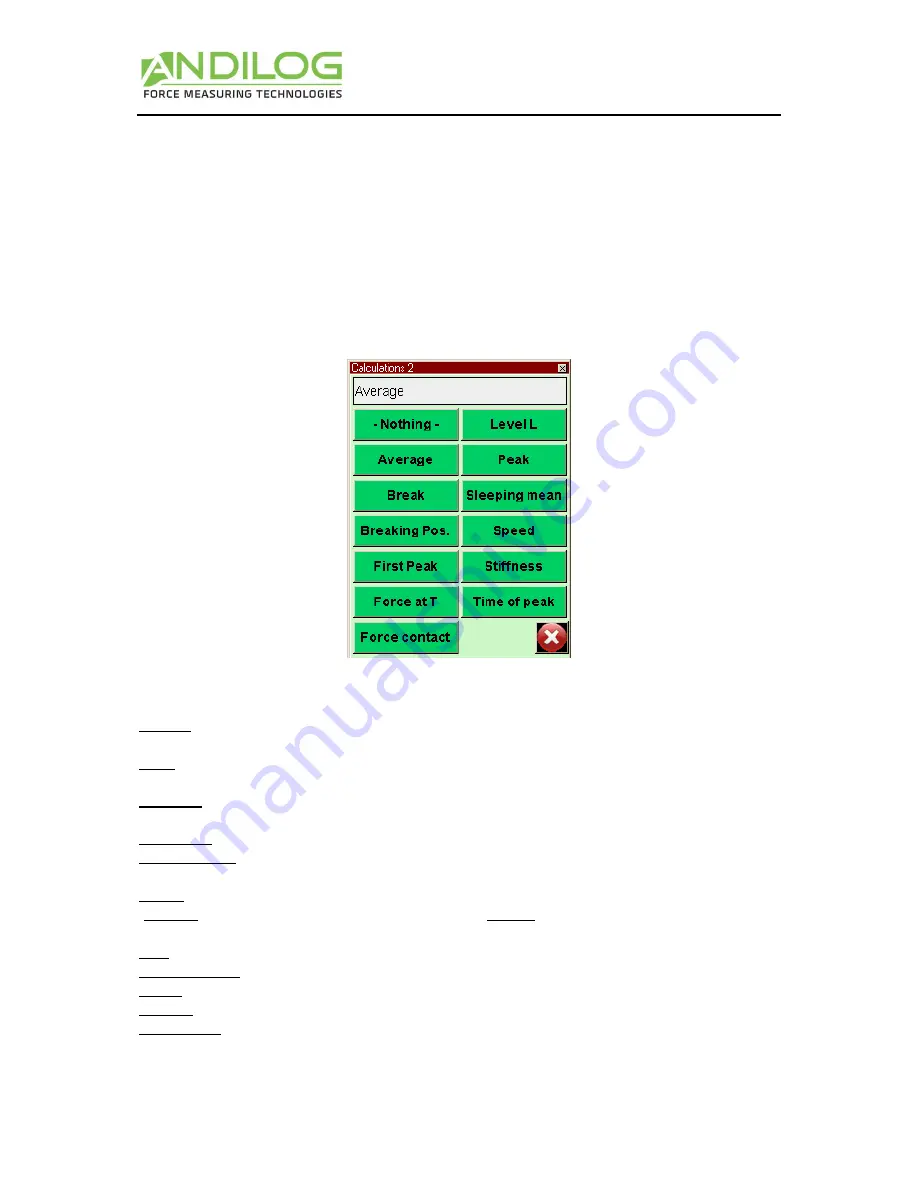
The following calculations are available: 

 
Average - The average of load readings over selected time or travel. Select time or travel parameters 
after selecting average. 
Break  -  The  calculated  break  point.  Select  the  percent  of  peak  to  determine  break  point  after 
selecting break. 
First  Peak 

  Select  the  first  peak  in multiple  peak  graphs.  Select  the  percent of  peak  to  determine 

peak point after selecting First Peak 
Torque at T -Torque at a specific time. Select time in milliseconds. 
Torque contact 

 Calculates the maximum torque when 

you’re

 closing a contact or a switch plug on 

the Input E1 (for example the external button on the wrench). 
Level  L 

  Calculates  the  value  of  a  channel,  when  the  other  channel  has  reached  its  defined  limit 

(absolute: the time increments when the test starts / relative: the time increments when the curve 
starts, meeting the start condition on torque value, to be used for Top load tests) 
Peak 

 The maximum torque or torque measured during the test. 

Moving average 

 Rolling average or running average 

Speed: Speed calculation in real time of the selected channel 
Stiffness: Calculate the slope of the curve between two values 
Time of peak: Return the time value when the peak have been reached 


Summary of Contents for GYROTORK DUAL

Page 1: ...auge Operating Manual GYROTORK DUAL V6 19 ANDILOG BP62001 13845 Vitrolles FRANCE info andilog com www andilog com Ph 33 442 348 340 COM TEN ANDILOG USA 6405 49th St North Pinllas Park FL 33781 USA sal...

Page 2: ...IV DISPLAY setup 11 1 Main screen 12 2 Auxiliary 12 3 Curve 12 4 Bar Graph 12 5 State 12 6 Digits 12 7 Time unit 12 8 Sensor Units V1 13 9 Set points Limits 13 V SET POINTS Setting Limits 13 1 Activa...

Page 3: ...Orientation 28 5 Language 28 XII MAINTENANCE Panel 29 1 General 29 2 Setting the clock 29 3 Channels tab 30 4 Factory configuration 30 5 Reset of the Gyrotork 30 XIII ASSOCIATED PRODUCTS 30 1 Acquisi...

Page 4: ...her performance and more reliable instrument Though it is a very comprehensive instrument the GYROTORK torque gauge is easy to use This instruction manual will guide you to set your first measurements...

Page 5: ...fe is 8 hours under normal use The gauge should be charged after normal use You should charge it every 3 weeks to ensure maximum life of the batteries It is recommended to use the original power adapt...

Page 6: ...ensor torque displacement or angle and its condition A red X indicates a disconnected sensor or a major failure A red exclamation point Indicates a minor issue on the sensor An overload or a calibrati...

Page 7: ...al lines which respectively symbolize 25 50 75 and 100 of power Press this field to access to the Main MENU 2 Sensor Capacity The capacity and unit of your device is displayed at any time even for add...

Page 8: ...main and auxiliary displays is shown in the upper left corner of each screen We will see in Chapter IV how to change the displayed value 7 Sensor direction An easy to remember small symbol indicates...

Page 9: ...res the gauge The gauge will take into consideration the weight of accessories hook or plate fixed on the sensor s rod Taking this action resets all memories and peak values NOTE When turned ON the GY...

Page 10: ...V6 19 GYROTORK DUAL version 9 III START your measurements The GYROTORK allows you to draw a graph of your test The following screen is displayed Graph Displaying Area First channel axis Angle axis Te...

Page 11: ...and by mode Waiting for an event to start Acquisition mode Acquiring data Test complete To start a new test tares the torque gauge If you would like to stop the test before the end of the time press t...

Page 12: ...t settings At the end of the acquisition the state indicator changes to At this step you can Read the graph Read calculated values during the test by touching the statistics window Download calculated...

Page 13: ...ows you to display a second selection 3 Curve You have 3 choices Displays the curve and two values select curve as in the figure above Shows two values but no curve select None Shows three values but...

Page 14: ...screen see the chapter Limits V SET POINTS Setting Limits To access the limits settings touch the bar graph on the main screen or touch the button limits from the Display screen The limits feature al...

Page 15: ...zzer if desired for each limit The set points will be displayed on the main measurement screen on the bar graph area and during the test the current reading will change of color when a limit is reache...

Page 16: ...e is zeroed the GYROTORK is waiting for an event to start the acquisition There are two types of possible events Load applied on the torque transducer External event for example Input on the torque ga...

Page 17: ...the curve is 1000 you will record a point every 0 01 second If the test is stopped after 5 seconds the acquisition will record 500 points and the resolution will still be equal to 10ms 3 Curve Resolu...

Page 18: ...eak point after selecting break First Peak Select the first peak in multiple peak graphs Select the percent of peak to determine peak point after selecting First Peak Torque at T Torque at a specific...

Page 19: ...calculates the sleeping mean the standard deviation and the mean divided by the standard deviation It is possible to record 3 results simultaneously Choose between the maximum the minimum and calcult...

Page 20: ...splay After a test is completed you can save the test results to the statistics array by pushing the icon To save the data you have to tare the gauge At the end of the test press the icon above to val...

Page 21: ...puter input sending the stored curve Bluetooth sending data continuously at 100Hz sending data upon request via the main screen a digital or a computer input sending the stored curve Analogue sending...

Page 22: ...al additional commands are available F Current value sensor 1 I Current value sensor 2 P Maximum value sensor 1 M Maximum value sensor 2 V Minimum value sensor1 B Minimum value sensor2 C Calculation T...

Page 23: ...selected in the menu Setup The Baud rate is fixed to 921600 3 Bluetooth Optional The Bluetooth connection allows wireless communication with a computer It can replace for example an RS232 or a USB cab...

Page 24: ...ose from Calculated values max min and calculations selected in the menu TEST Raw data the value measured by the sensor at the time of communication Curve save the curve plotted on the screen Curve an...

Page 25: ...rtual keyboard The 1 2 3 button allows you to insert an automatic counter to the name of the directory curve This counter is symbolized by the sign 3 The button is used to safely eject the USB DATASTI...

Page 26: ...ft bottom corner the button allows direct access to the Stick setttings screen d Use multiple USB sticks The USB stick supplied by ANDILOG at the time of the purchase of the DATASTICK option has been...

Page 27: ...puts can change state under different conditions depending of the settings of the torque gauge The main states are Nothing no action Calculus 1 changes state at the end of calculation 1 Calculus 2 cha...

Page 28: ...t Stop the test Tare Vx tare the channel Vx F Contact used during the calculation For each input it is possible to define its default value at the beginning of the test high or low Low Level High Leve...

Page 29: ...me in seconds then touch the check key on the keypad to save Time out Screen Individually adjustable times for display back light power down Separately set times for battery and charger Touch the sele...

Page 30: ...displays the health details of all sensors connected and battery conditions Color Display color capabilities of the display Touch pad Allows calibration of the touch pad 2 Setting the clock Date and t...

Page 31: ...ersonalized test reports For more information about the Software Caligraph click on the HELP icon in the software and you will download the manual 2 Interface Cables Several interface cables can be us...

Page 32: ...S 1 Error Messages Information screen This screen is displayed after completion of internal tests and a minor or major defect has been found Minor defects Low battery Number of overloads less than 10...

Page 33: ...Instruction Manual V6 19 GYROTORK DUAL version 32 2 Factory Settings Default screens Communications default Test default Setups default Statistics default Maintenance default 3 Connections...

Page 34: ...hm pull up to 5 volts DC 9 Gauge reset 10 Analogue output 11 I2 input 12 Not used 13 Not used 14 USB device power 15 USB host power 16 O4 output Open collector requires 50 k ohm pull up to 5 volts DC...

Page 35: ...1 Send peak data after test complete with send key to the RS232 port Touch information bar Touch the communications icon RS232 touch to activate Set TORQUE 1 to peak Set speed parity stop bits and num...

Page 36: ...Instruction Manual V6 19 GYROTORK DUAL version 35 5 Dimensions...

Reviews: