


Preliminary Technical
Data
Rev. PrA | Page 79 of 82
Analysis of Results With 10us Batch Sampling Period
Based on experiment results, a direct correlation between Tx output power variation, and CLGC loop gain variation was noticed.
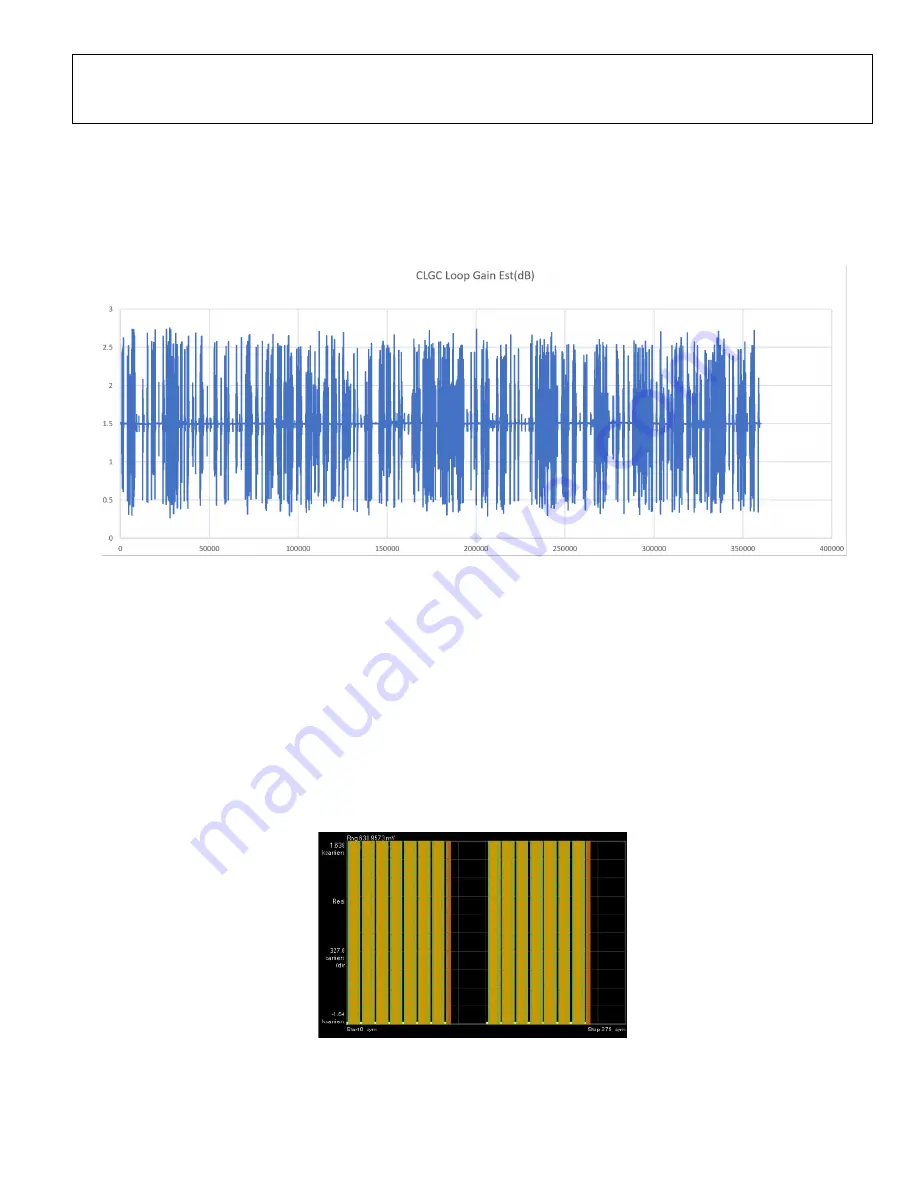
Shown below is the CLGC loop gain variation data collected with the 5GNR TM2 signal(described in Section 2) as the test vector,
with target loop gain set to 1.5dB. A dynamic range of +/-1.2dB can be noticed over time, with the CLGC batch sampling period
configured as 10us.
Figure 77. CLGC Loop gain vs Time
Factors Affecting CLGC Loop Gain Estimation
1)
Signal Characteristics
: As outlined in Signal Under Test section, the TM2 signal has a symbol period of 33.34us.
Furthermore, each symbol period does not have all the sub-carriers active. The time-frequency resource block allocation is
highlighted in section 2.1, and the time distribution of the frequency content is captured in section 2.3.
2)
PA Characteristics:
The PA gain over frequency is not constant, as captured in the PA Characteristics section. Given the
signal under test has sub-carriers separated by ~50MHz, and they are all not active in the same symbol period, the gain
estimated depends on the symbols captured by the ORx.
3)
CLGC Sampling Period
: As noted by the signal characteristics, and the PA characteristics, the CLGC might have to sample
multiple symbols in order to get a good composite view of the loop gain across frequencies. The default CLGC sampling
period of 10us / batch is less than 1 symbol period of the signal under test. To get a composite view of the overall gain, the
CLGC needs to sample a larger amount of data for loop gain estimation. Contrast this with a fully filled TM3.1 signal in Figure
78, which has all the sub-carriers active in one symbol period, and it does not require a larger sampling period to get a good
composite view of the gain.
Figure 78. Fully occupied TM3.1 signal, time-frequency resource block view