32
Naming Your Chart
Each chart displayed on the screen has a default header, describing the measurement displayed. The
default
heading for the SWR chart is “SWR Plot”, for example.
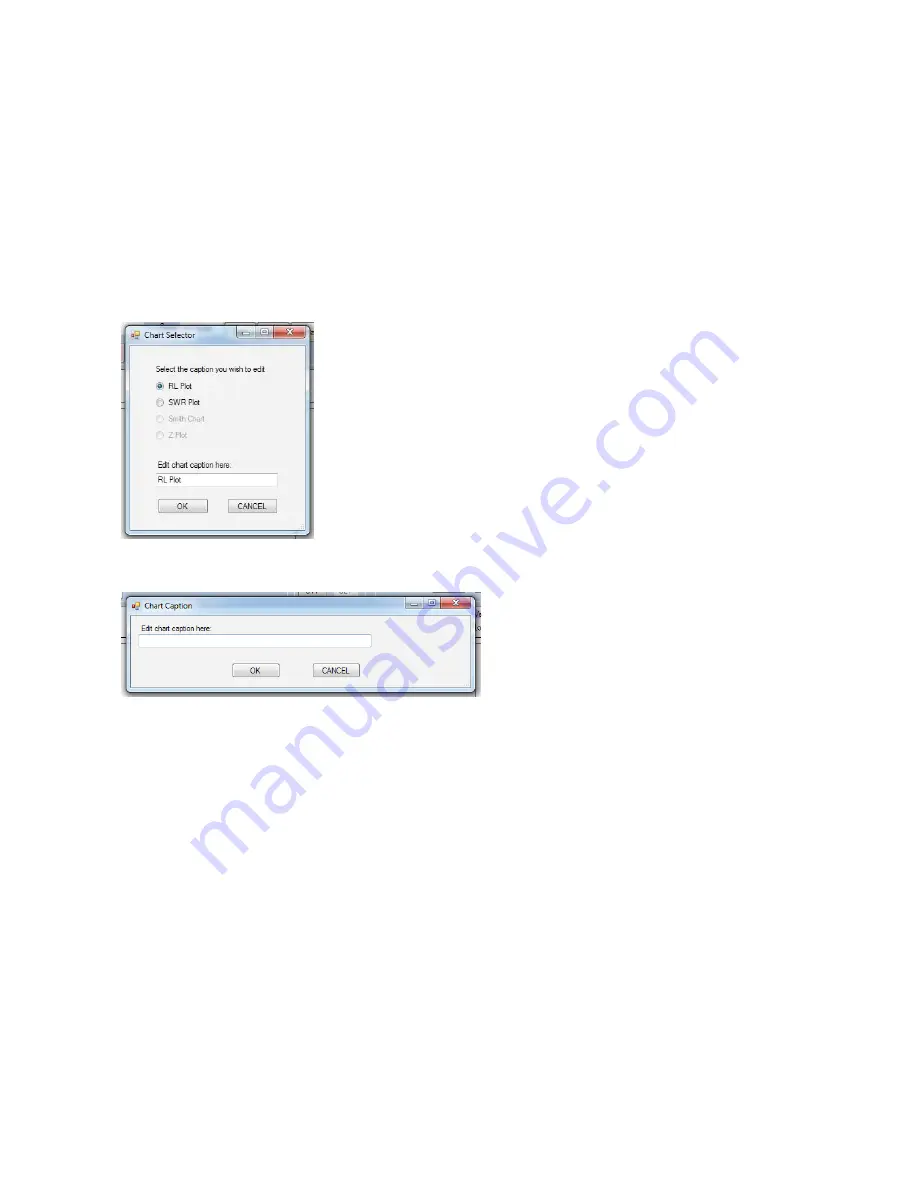
Any chart can be renamed by simply double-clicking on the title you wish to change, and this dialog
will pop up, allowing you to make whatever changes you want.
If you have more than one chart displayed, you will be given the opportunity to choose which chart
you want to label:
Select the chart, and type in the new header at the bottom, click OK to save.
If you only have one chart showing, this dialog box will be displayed:
Enter the new caption, and click OK.


