


Table 5.1.3-1 Display items
Description
Item
The trend value line shows the values corres-
ponding to the selected time.
Trend value line
The column shows the values corresponding to
the selected time.
Pointed time
The column shows the value at the time of the
selected trend value line or, if the line has not
been selected, the value at the time which the
cursor points to.
Value corresponding to the pointed time
Zooming in
5.1.4.
To define the area you want to zoom in:
1.
Place the pointer in the plot area, move it to the left side of the area and press and
hold the mouse button.
2.
Drag the pointer to the right side of the selected area. The selected area is highlighted.
3.
Release the mouse button.
If the text boxes displayed on the time span row show the start and end time of the
selected area, the history update bar has been defined and you can change the start
and end times.
4.
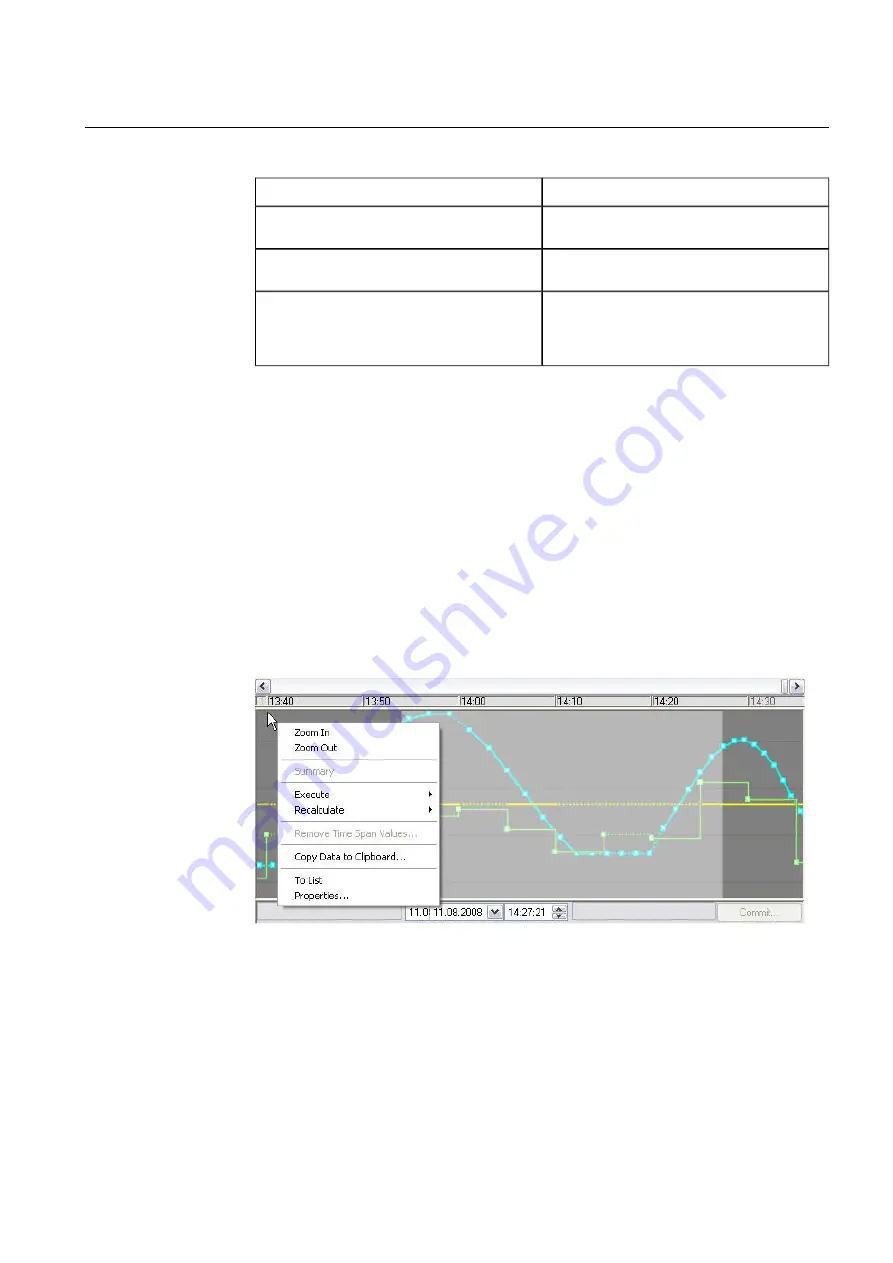
Right-click in the plot area and select Zoom In from the pop-up menu. The selected
time span now fills the entire plot area. The time span is locked, the pins are pushed
down, and the interval and curves are no longer refreshed.
displayterms.jpg
Figure 5.1.4-1 Display terms
To refine the selection, modify the start and end times in the boxes. The highlighted area
changes accordingly.
53
COM600 series, Version 5.0
1MRS756739
Data Historian Operator's Manual
Summary of Contents for COM600 series
Page 1: ... COM600 series Version 5 0 Data Historian Operator s Manual ...
Page 2: ......
Page 6: ...6 ...
Page 132: ...132 ...
Page 136: ...136 ...
Page 137: ......
Page 138: ......
Page 139: ......


