To view the values of the graph, place the pointer over the graph. The tool tip box shows
the value, time stamp, and status of the data point closest to the left of the pointer (See
5.1.1, Viewing the value of the graph in the tool tip box).
Moving the pointer in the plot area displays the time and all the calculated values of line
and area plots in the pointer's location. The Pointer Value column must be selected in
the legend (See 5.1.3, Viewing trend values).
You can also zoom in to view a certain part of the time span in more detail. Zooming in
moves the left side of the selected time span to the left side of the plot area and the right
side of the time span to the right side of the plot area. You can zoom in repeatedly.
Zooming out cancels the effects of zooming in, step by step. To return to the original
view, zoom out as many times as you zoomed in.
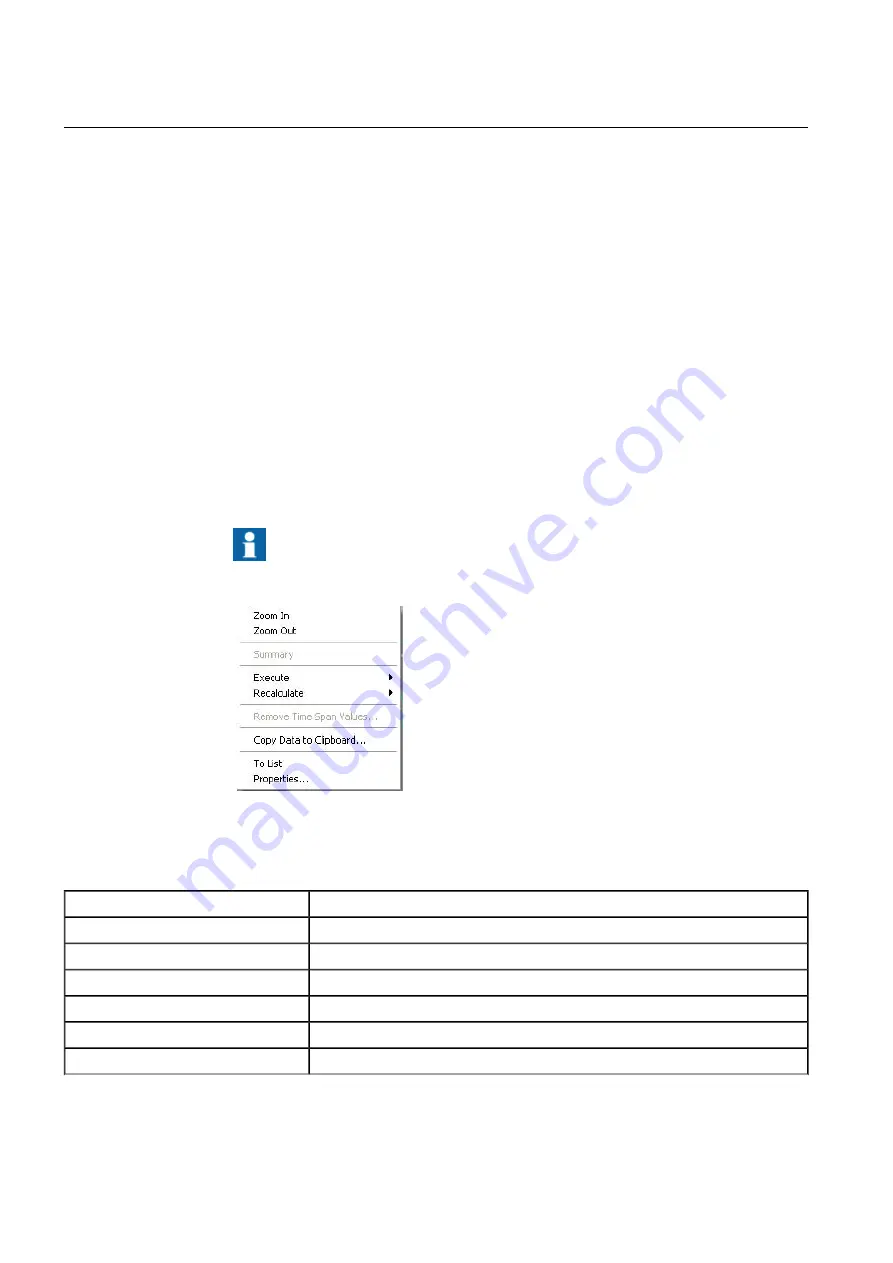
With the chart pop-up menu you can also view summary values of the plots, view trend
values, zoom the plot area, copy data to the clipboard, and change the chart format to
list or graph.
Only those options that are possible for your selection are
active.
Popup_menu.jpg
Figure 5.1-2 Chart pop-up menu
Table 5.1-1 Pop-up menu items
Description
Item
See 5.1.4, Zooming in.
Zoom In
See 5.1.5, Zooming out.
Zoom Out
See 5.1.2, Viewing summary values.
Summary
Startup of applications defined in the system.
Execute
Startup of applications defined in the system.
Recalculate
See 5.1.6, Copying data to clipboard
Copy Data to Clipboard
48
1MRS756739
COM600 series, Version 5.0
Data Historian Operator's Manual
Summary of Contents for COM600 series
Page 1: ... COM600 series Version 5 0 Data Historian Operator s Manual ...
Page 2: ......
Page 6: ...6 ...
Page 132: ...132 ...
Page 136: ...136 ...
Page 137: ......
Page 138: ......
Page 139: ......


