YO Airflow Pro
User guide
v1.0
page 22/26
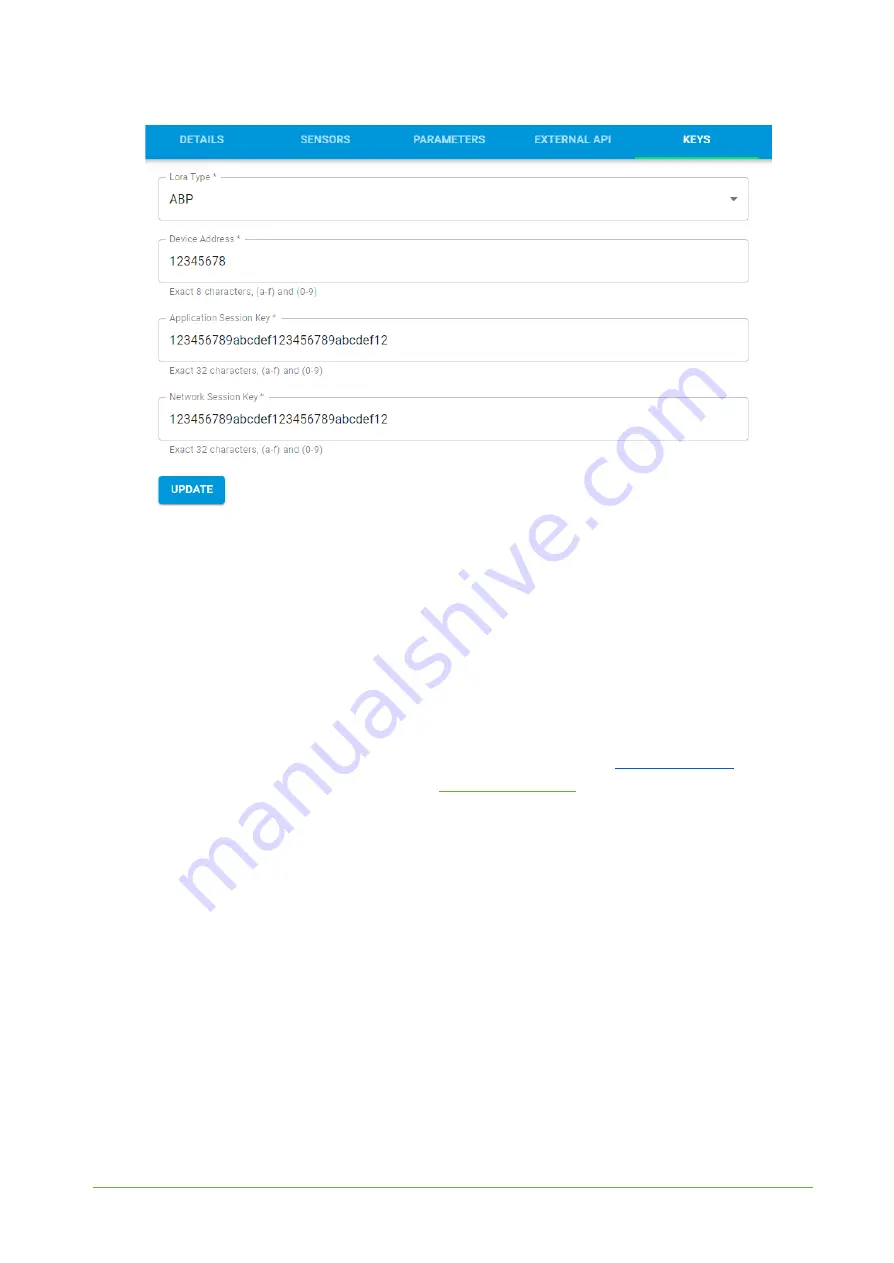
Figure 17
Node LoRa type configuration form.
6. When data is received by the server, you’ll notice that the ‘Last Seen’ column (‘NODES LIST’
tab) status changes from ‘never’ to ‘a few seconds ago’.
7. Open charts by clicking on the ‘OPEN’ button in Dashboard columns or by entering the
node’s ‘DETAILS’ tab (‘Node Name’ column link) and clicking ‘CHARTS’.
Payload description
If you want to connect to your own server you have to decode the payload specific to each device. To
do this you need a payload decoder which can be downloaded from
. Extended
documentation of the protocol can be found at
.. An exemplary payload produced
by YO Airflow Pro is presented below with division into each measurement marked together with
decoded values whose interpretation is described in the Payload description document.
Example of YO Airflow Pro payload with description:
02:00:00:00:08:00:01:11:ce:0d:00:01:00:f0:10:00:00:42:41:00:05:fe:f5:00:60:00:bd:15:00:01:08:
ab:0d:00:11:25:00:f7
REV 1.0


