SA
FET
Y N
OTE
S
DE
VIC
E F
EATU
RE
S
HAR
DW
AR
E P
ACK
AG
E
HA
RD
W
AR
E
CO
MP
ON
EN
TS
AP
P IN
STAL
L
BA
TTE
RY
IN
SER
TIO
N
TAK
IN
G
ME
ASU
REME
NTS
OTH
ER
SC
REEN
S
M
AIN
TEN
AN
CE
TRO
UB
LE
-
SH
OOT
ING
W
AR
RAN
TY
AN
D
AF
TER
-SER
VIC
E
SPE
CIFI
CAT
ION
S
LA
WS A
ND
RE
GU
LA
TIO
NS
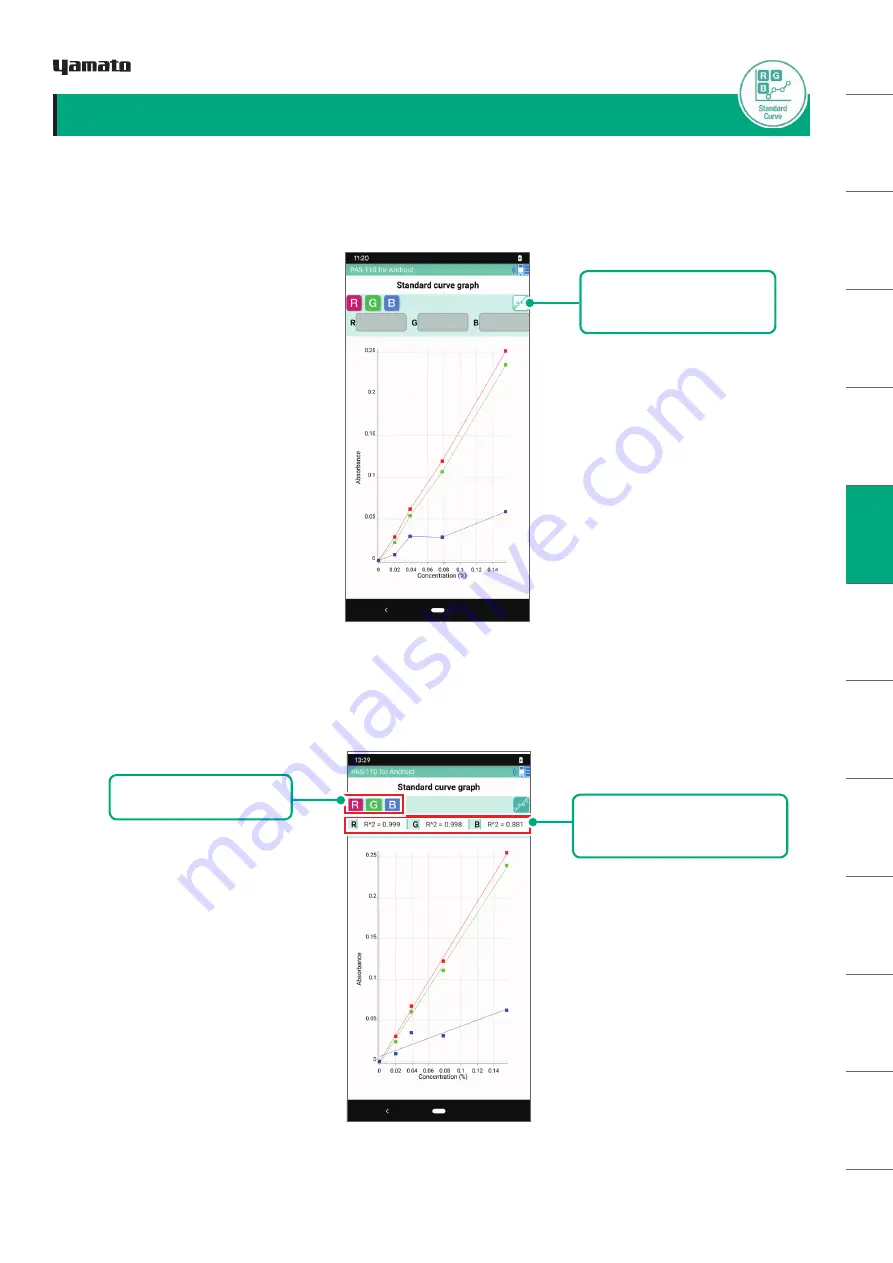
Illustration 3-9:
Standard Curve Graph Screen
Illustration 3-10:
Fitting a Line to the Measured Data Points
②
Determination Coefficient
Display Area
③
RGB Switch Buttons
(2)
When you tap the
①
Standard Curve Graph Switch Button
, graph displayed changes to show
a least squares linear regression line for the data (Illustration 3-10). Also, the coefficient of
determination (R
2
) is displayed at
②
. This value indicates the linearity of the data how well the least
squares line fits the data is indicated by this value.
①
Standard Curve Graph
Switch Button
TAKING MEASUREMENTS
3-4. Graphing the Standard Curve
Here we explain how to check the graph of created calibration curve.
(1)
When you tap the
Standard Curve Graph Display Button
, a graph appears indicating concentration
on the horizontal axis and absorption on the vertical axis (Illustration 3-9).
(3)
All of the RGB graphs appear in the initial display. Graph display of each of the RGB graphs can be
switched on or off using the
③
RGB Switch Buttons
.
TAK
IN
G
ME
ASU
REME
NTS
18
Copyright © 2019, USHIO INC. All Rights Reserved.


