14-1
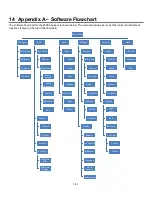
14 Appendix A – Software Flowchart
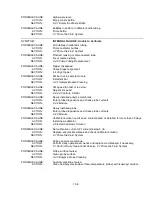
The software flow chart for the 2500 Analyzer is shown below. The main screen has six icons that control all instrument
functions (shown at the top of the flowchart).
Main Menu
Configure
Membrane
Calibrator
Endpoint
Volume
Run
Run Batch
Plate ID
Batch Name
Multi-
Sample
Batch
Repeats
Dilution
Chemistries
Units
Status
Module
Printout
Results
Run Stat
Configure
Stat
Configure
Syringe
Data
Plate
View
Date
Filter
Export
Calibration
Date
Export
Settings
System
Calibration
Auto-cal
Sceduled
Sipper
Fluid Det
Sensors
Bottle
Interlocks
Display
Reports
Print Config
Brightness
Language
Clock
Format
Screensaver
Service
Sipper
Position
Depth
Home
Sensors
Interlocks
Module
Sipper
Pump
Flush
Calibrate
Controls
Pumps
Stirbar
Help
About
Software
FAQ
Содержание YSI 2500
Страница 1: ...USER MANUAL 525021 YSI 2500 Biochemistry Analyzer OPERATIONS AND MAINTENANCE MANUAL...
Страница 34: ...5 11 8 The Stat sample results are displayed on the Run Stat tab Stat sample results...
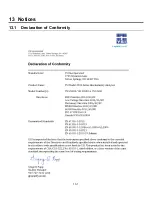
Страница 88: ...13 1 13 Notices Declaration of Conformity 13 1...
Страница 96: ...17 1 17 Appendix D Line Power Cord and Plug Wiring United Kingdom United States Europe...


