XT2640 Operating Manual
13 July 2016
Page 62 of 187
and it needs to know the fundamental frequency. Since the XT2640 always ensures that every cycle of the signals are sampled at
different phases within them, a complete high resolution image of a single cycle is obtained using the actual samples of the actual
signals.
If no traces are enabled to be shown on the chart then NO TRACES SELECTED is displayed on the chart and the chart is blank.
If the period is shown colored orange then the XT2640 is not locked closely enough to allow an accurate representation of the
signals.
You can press the AUTOSCALE button to rescale all traces to the most optimum 1/2/5 scales (per division) to maintain all traces just
within the vertical extents of the chart. This action changes the scaling for each enabled trace entered in the TRACES configuration.
12.10.1.1
CONFIGURING
TRACES
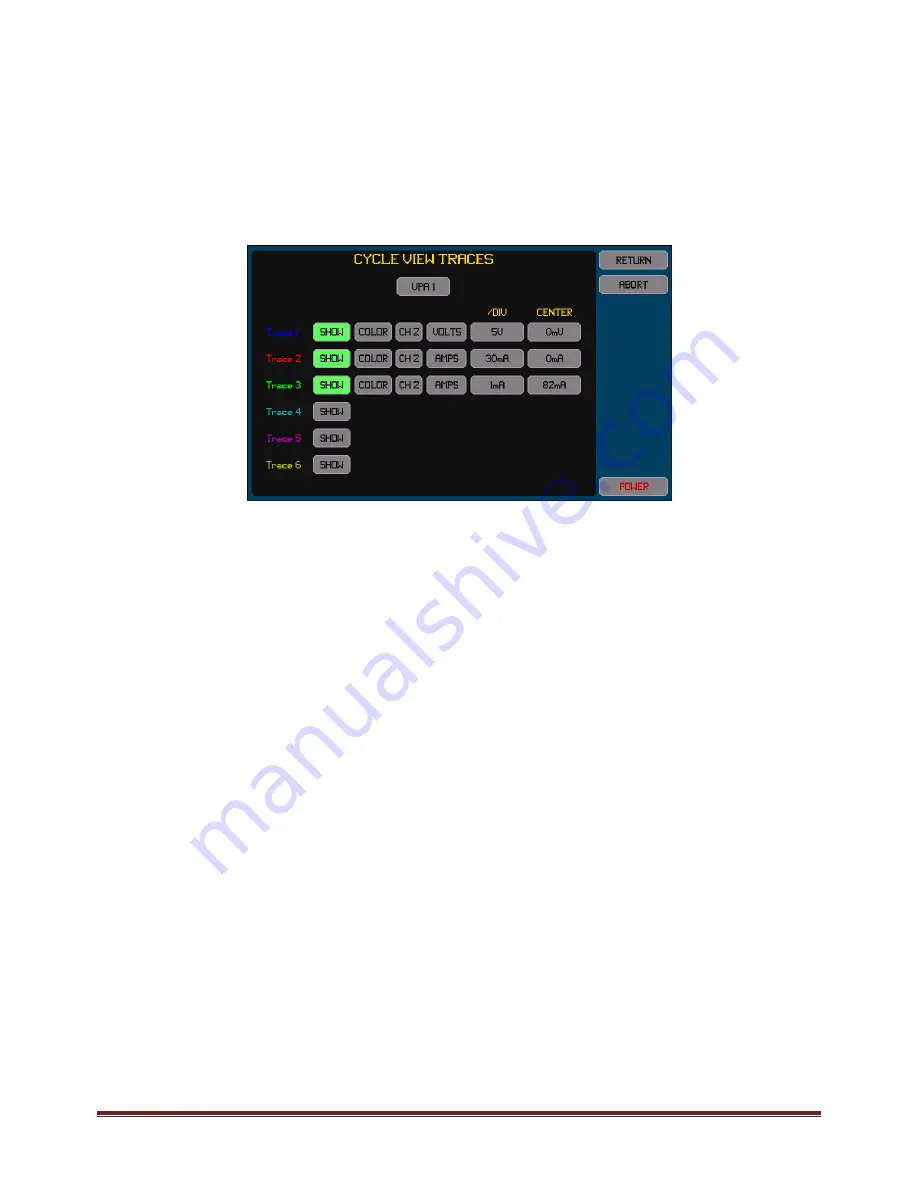
The only configuration needed is to select the traces and to set the trace color, scaling and offset for each. This is performed by
pressing the TRACES button. An example of the screen which allows configuration of the traces is shown below.
All traces must be from the same VPA, so the required VPA must be selected prior to selecting any traces.
For each trace–
Pressing the SHOW button toggles the trace on/off. The button is highlighted colored green when enabled.
Change the color by pressing the COLOR button until the adjacent trace number shows the desired color.
There are two buttons to the right of the COLOR button which allows you to select the channel and signal to trace. Either
the voltage or current or watts signals or the inter‐phase voltage signals may be traced. The watts signal is the result of
multiplying the voltage and current signals.
The button in the /DIV column allows you to set the scaling in the units of the selected signal. Note that this is entered per
division and there are a total of 6 vertical divisions in the chart (3 above and 3 below the centerline). This can also be set to
the best 1/2/5 values to show all traces within the extents of the chart when the AUTOSCALE button is pressed on the
CYCLE VIEW screen.
The button in the OFFSET column allows you to set the signal level which will correspond to the centerline of the chart.
Note:
Traces are drawn in numerical order, trace 1 first, and then trace 2, and so on. So the highest numbered enabled trace is
the uppermost trace if traces overlap.
If a VPA is configured to a LF/PERIOD setting of another VPA then selecting either VPA will allow the signals in either VPA
to be selected.
12.10.1.2
EXPORTING
OR
RECORDING
CYCLE
VIEW
DATA
The methods for performing this are fully described in section 23.
The CYCLE VIEW data can be exported to a .CSV format textual file on an external USB drive attached to the front panel USB port.
This file contains a tabulation of the points in each CYCLE VIEW waveform for all channels in a selected VPA.
Briefly, this is performed by –
1.
Insert the drive into the front panel USB port and wait for it to be READY.
2.
Press the DRIVE INFO area of the screen, the screen shows the file export/import screen.
3.
Press the CYCLE DATA button. The screen changes to allowing you to enter a file name.
4.
Enter the desired file name (the extension is automatically provided).
5.
If the file already exists then you are prompted to respond if you wish to overwrite it or not.
6.
If configured for more than a single VPA then you are prompted to select the VPA for which to export the cycle view data.
7.
The file is then written.
Alternatively you can make a record of the CYCLE VIEW screen by saving an image of it to a graphic file on an external USB drive
attached to the front panel USB port.
Briefly, this is performed by –
1.
Insert the drive into the front panel USB port and wait for it to be READY.


