WX-500-0317
© 2020 Wavetronix LLC. All rights reserved. Protected in the US by patents viewable at www.wavetronix.com/en/legal. Protected by Canadian Patent Nos. 2461411; 2434756; 2512689; and European Patent Nos. 1435036;
1438702; 1611458. Other US and international patents pending. Wavetronix, SmartSensor, Click, Command and all associated logos are trademarks of Wavetronix LLC. All other product or brand names as they appear are
trademarks or registered trademarks of their respective holders. Product specifications are subject to change without notice. This material is provided for informational purposes only; Wavetronix assumes no liability
related to its use.
11
Graphs
The
Graphs
tab can generate tables and graphs for volume and
arrival on green data, based on the last week’s work of data:
˽
Under the
Data Summary
tab, you can view a table of
counts and AoG% info for all currently mapped channels.
Use the setting on the left to choose the time frame for
which to show data.
˽
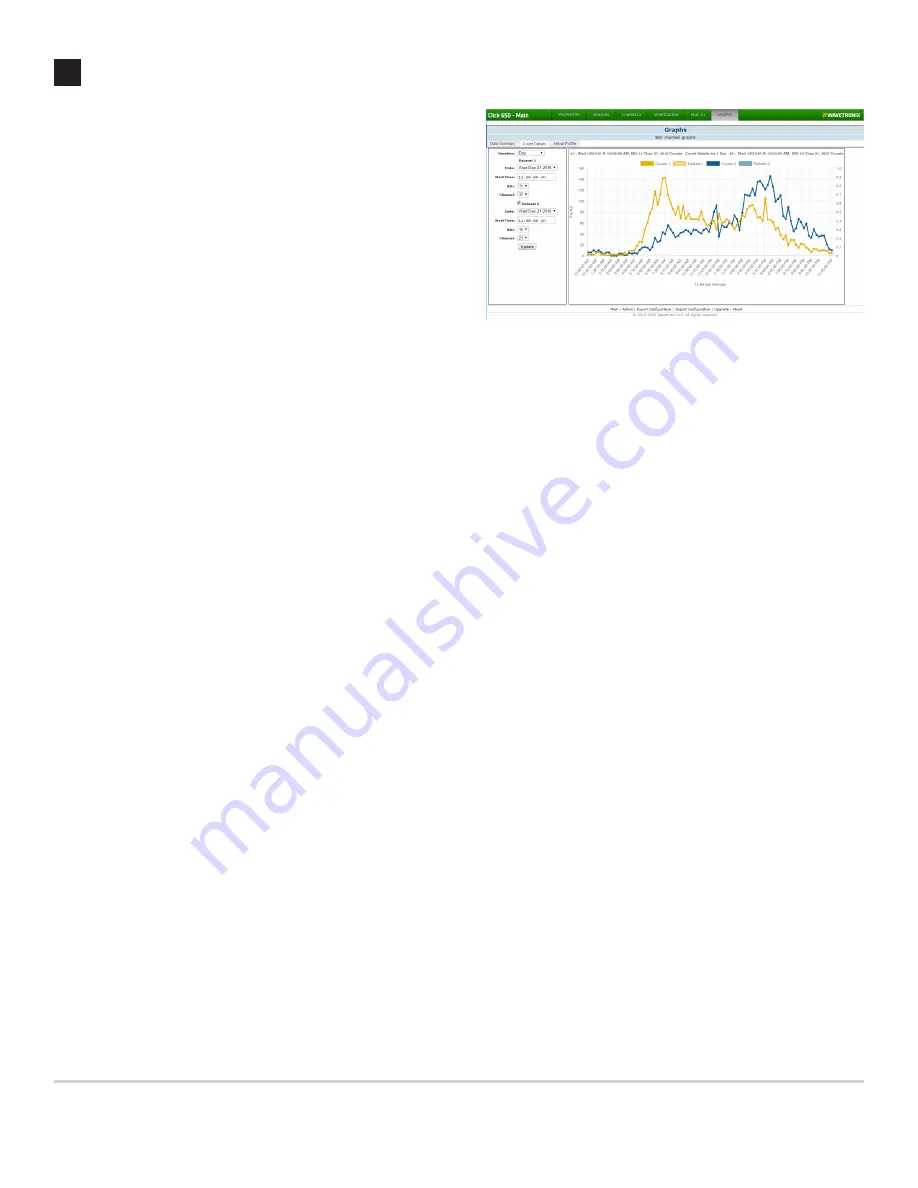
The
Count Details
tab generates a line graph showing
counts over time on a given channel or channels. Use the
settings on the left to choose the channel(s) and time frame.
˽
The
Arrival Profile
tab generates a bar graph showing the
number of vehicles arriving on red vs. those arriving on
green over time. Use the settings on the left to choose the
channel and time frame.


