2022/07/21 23:14
11/30
SLICE-QTC Four-Channel Temperature Controller
Product Manuals - https://www.vescent.com/manuals/
screen from the Home screen, touch the CH button for the appropriate channel (
shows the CH 1 Detail screen. From this screen, you can change T
set
, and initiate temperature control
as from the Home screen. You can also visually monitor the performance of the loop. When the lock is
engaged, the graph in the lower right of the screen displays ∆T (T
act
- T
set
) on a rolling basis. The yellow
dashed lines indicate the user-defined “lock range” (see
to ±3 mK. If ∆T is outside of this range, the Error field background will change from green to yellow.
Change the speed of the rolling display: touch the
button and select from 1 to 20 s/div.
Change the scale of the vertical axis: touch the
button and select from 1 mK/div to 10
K/div.
Pause and restart the rolling screen: touch the
Turn on & off cursors on the graph: touch the
button. It is possible to drag the cursors
across the display of ∆T to measure an oscillation period. This function will be helpful when
tuning the loop parameters to your plant.
Adjusting the Graph
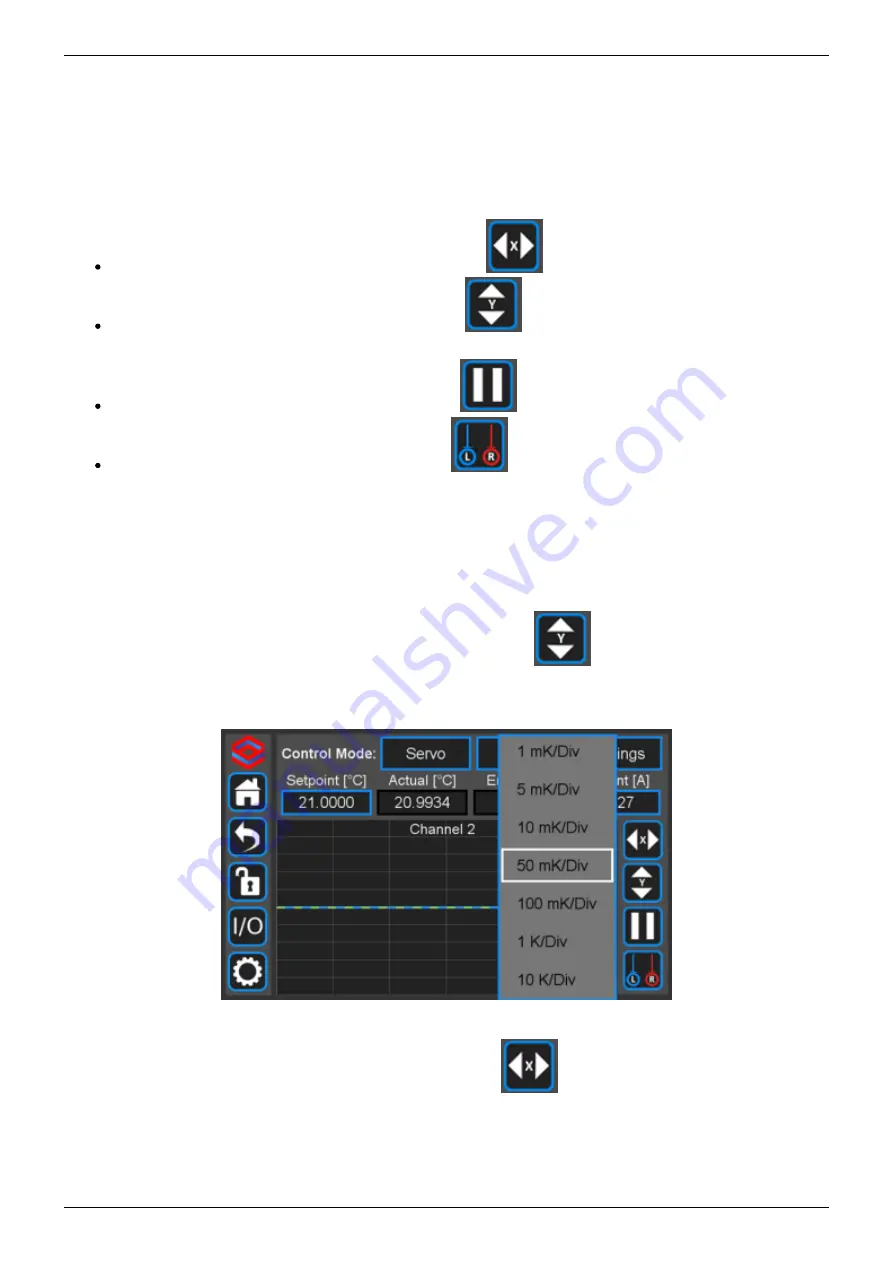
To adjust the vertical range (∆T) of the graph, either touch the
), or turn the right rotary knob.
Fig. 19: Menu to adjust y-axis on temperature plot
To adjust the time base (∆t) of the graph, either touch the
button and select an option from
the pop-up menu (


