background image

LabQuest

®

2 – User Manual 


Internal Sensors 

LabQuest also has several built-in sensors, including 

GPS, microphone, three-axis accelerometer, 

temperature sensor, and relative light sensor. 

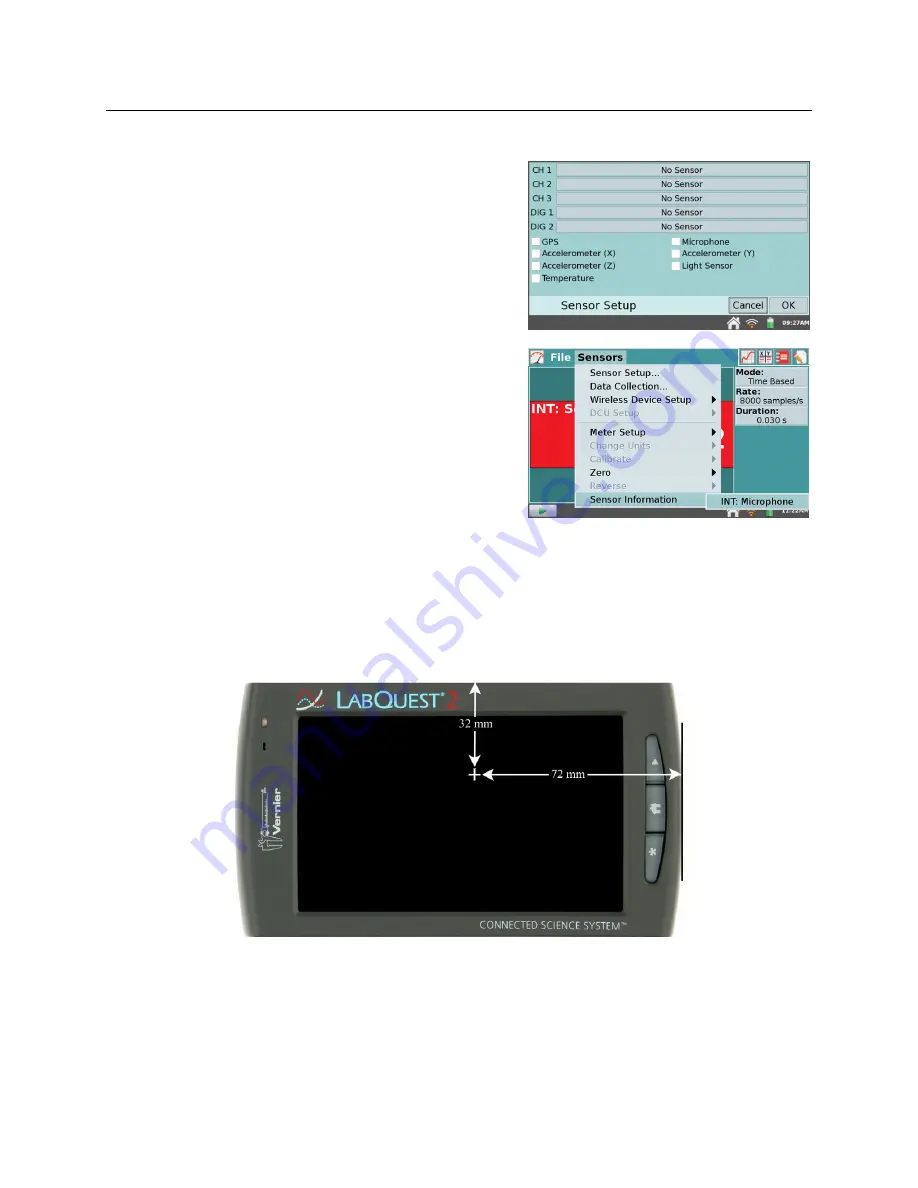
To enable internal sensors within LabQuest App, 

choose Sensor Setup from the Sensors menu. Within 

the Sensor Setup dialog box, select a check box to 

enable the associated sensor. Then tap OK to return to 

the LabQuest App Meter screen.  

For additional information on internal sensors, enable 

the sensor and then choose Sensor Information from 

the Sensors menu. Choose the desired sensor from the 

list of enabled internal sensors. 


GPS


– The internal GPS collects latitude, longitude, 

and altitude readings, and may be used with other 

sensors. You can choose units of decimal degrees, 

degree minutes, or UTM.  


TIP!

 It may take up to 15 minutes to acquire an 

initial signal outdoors. We do not recommend using 

GPS indoors.


Accelerometers


– The 3-axis accelerometer measures accelerations up to 

g

 in the x-, y-, 

and z-axis directions. The sensor is located 72 mm from the docking connector and 32 mm 

from the digital port side of the plastic case. 


Содержание LabQuest 2

Страница 1: ...LabQuest 2 User Manual Version 2 8 5 May 2019 ...

Страница 2: ... GUIDE LabQuest 2 released in March 2012 ships with a Quick Start Guide to get you started with basic data collection and analysis The LabQuest 2 User Manual is an extended guide detailing the features hardware and software of LabQuest 2 ...

Страница 3: ...rrect the interference by one or more of the following measures Reorient or relocate the receiving antenna Increase the separation between the equipment and receiver Connect the equipment into an outlet on a circuit different from that to which the receiver is connected Consult the dealer or an experienced radio TV technician for help FCC Caution This device complies with Part 15 of the FCC Rules ...

Страница 4: ... other antenna or transmitter Le présent appareil est conforme aux CNR d Industrie Canada applicables aux appareils radio exempts de licence L exploitation est autorisée aux deux conditions suivantes 1 l appareil ne doit pas produire de brouillage et 2 l appareil doit accepter tout interférence radioélectrique même si cela résulte à un brouillage susceptible d en compromettre le fonctionnement Cet...

Страница 5: ... IV DATA SHARING USING LABQUEST 2 32 How Data Sharing Works 32 Setting Up Data Sharing on LabQuest 32 Connecting to LabQuest 2 from Your Device 37 V USING LABQUEST 2 WITH A COMPUTER OR CHROMEBOOK VIA USB 39 Collecting Data with Logger Lite Logger Pro 3 or Graphical Analysis 4 39 Transferring Data from LabQuest to Logger Pro 3 or Logger Lite 39 Transferring Data from LabQuest to Graphical Analysis ...

Страница 6: ...uest 2 Technical Specifications 49 Appendix B LabQuest Maintenance 50 Appendix C LabQuest Keyboard 52 Appendix D License Information 53 Appendix E Warranty 53 Appendix F Curriculum Resources 53 Appendix G Accessories Replacement Parts and Related Products 54 ...

Страница 7: ...code LQ2 CRG sold separately LabQuest uses a high quality lithium ion battery This is the same chemistry used in premium laptop and cell phone batteries and you can expect similar performance There is never a need to condition the battery by regular full discharge charge cycles It is safe to leave the battery charging indefinitely and there is no need to fully discharge the battery before charging...

Страница 8: ...he graph autoscales to the data 4 Tap the graph to examine a point of interest The coordinates of the point are shown in the panel to the right of the graph Tap another point or tap the Examine buttons to move the cursor left and right 5 To select a region of data for analysis tap and drag across the graph to highlight the desired region TIP To analyze all data you do not need to select a region S...

Страница 9: ...ation LabQuest automatically determines and displays the fit coefficients and displays a preview of the curve fit on the graph Tap OK to apply the fit and return to the Graph screen To remove the fit choose Curve Fit from the Analyze Menu and then select the checked box to clear the selection TIP The Curve Fit coefficients cannot be manually adjusted To enter your own parameters see the Model tool...

Страница 10: ...sleep mode Note that sleep mode does not start until you release the power button In this mode LabQuest uses less power but the battery can still drain This mode is useful if you are going to return to data collection again soon in which case waking LabQuest from sleep is quicker than restarting after shutdown To wake LabQuest from sleep press and release the power button When LabQuest is left asl...

Страница 11: ...e check box for High Contrast to enable this mode Hardware Keys In addition to using the touch screen the three hardware keys can also be used to control your LabQuest Collect Start and stop data collection within LabQuest App Home Launch the Home screen to access other applications Escape Close most applications menus and exit dialog boxes without taking action i e cancel dialog boxes Sensor Port...

Страница 12: ...e side opposite of the analog ports there is a stylus storage slot an AC power port for recharging the battery and a mini USB port for connecting LabQuest to a computer In between these ports there is a serial connection for charging the unit in a LabQuest Charging Station order code LQ2 CRG sold separately and a stylus tether attachment point ...

Страница 13: ...al sensors enable the sensor and then choose Sensor Information from the Sensors menu Choose the desired sensor from the list of enabled internal sensors GPS The internal GPS collects latitude longitude and altitude readings and may be used with other sensors You can choose units of decimal degrees degree minutes or UTM TIP It may take up to 15 minutes to acquire an initial signal outdoors We do n...

Страница 14: ... both visible and infrared light and one filtered photodiode CH1 which is responsive primarily to infrared light The CH1 reading is subtracted from the CH0 reading and then converted to a value in lux that represents illuminance ambient light level to approximate the human eye response The spectral response range for this sensor is approximately 400 800 nm Microphone The internal Microphone is loc...

Страница 15: ...abQuest App has five different screens Tap on the desired tab to display the associated screen LabQuest App Meter screen Set up sensors set data collection parameters and see a meter for your connected sensors For a detailed description of how the Meter screen is used for data collection see Data Collection Graph screen See a graph of your data and perform analyses including curve fits For a detai...

Страница 16: ...bles analyses and even notes These files have a qmbl extension and can be saved to the internal storage space on LabQuest or to an external storage device such as a USB flash drive or microSD card LabQuest App files can also be opened and manipulated on a computer with Logger Pro 3 and Logger Lite software All five tabs within LabQuest App share the same File menu which is similar to the File menu...

Страница 17: ... Choose Export from the File menu to export the current data file in a text format for use with other applications Tap on a source icon USB SD to select a destination then tap OK to complete the export A typical use of this feature is to export a text file to an SD card or a USB flash drive for further data manipulation on a computer with a spreadsheet program The exported file contains all column...

Страница 18: ...ction with LabQuest starts from the Meter screen which is the default screen for LabQuest App From this screen you can view sensor readings updated in real time as well as a summary of the data collection settings Additionally you can access updated tools to modify and customize these settings for your particular experiment Digital Meters A digital meter for each connected sensor is shown on this ...

Страница 19: ... collection modes e g Events with Entry a Keep button will appear to the right of the Stop button In this mode you must tap to record the data point in the data table For more information see Events with Entry Data Collection Settings The Sensors menu provides access to detailed setup controls Use this menu to set up internal sensors non auto ID sensors and wireless sensors You can also use this m...

Страница 20: ...mples to be collected based on these parameters will be displayed Warning Messages Under some circumstances the Rate and Duration fields may be highlighted in yellow or red The yellow warning indicates that the rate has been set to a value slower or faster than what is recommended for the connected sensor or that the number of samples could lead to performance issues You can still collect data usi...

Страница 21: ...e by combining a burst of readings into one value As an example oversampling can sometimes reduce the influence of unseen but real variations such as as those from a flickering light source Repeat can be used with data collection rates less than 250 samples per second When enabled a new data collection run is started as soon as the current run has ended Data for each run is overwritten when a new ...

Страница 22: ...t variable e g gas volume in the Boyle s law experiment Sensor data are plotted against the independent variable as shown in the screenshot to the right o Mode Selected Events Selected Events mode is similar to Events with Entry except that entries of 1 2 3 are automatically recorded as the independent variable To record time information in place of an entry value select the check box for Use Time...

Страница 23: ...djust the default value using the arrows These values will be reflected in the preview of the time dependent temperature graph displayed to the right After setting the parameters tap OK to initiate the Mini GC warm up For more detailed information on the Vernier Mini Gas Chromatograph see www vernier com gc2 mini o Mode Drop Counting This mode is used with the Vernier Drop Counter When using this ...

Страница 24: ...p OK Repeat as needed to connect up to three Go Direct sensors Once connected to a Go Direct device tap on its meter and choose Go Direct to access additional setup options Choose Device Details to determine the battery level or to view hardware and firmware details Choose Identify to flash the LED on the Go Direct sensor to ensure you are connected with the desired sensor Choose Disconnect to end...

Страница 25: ... to ensure you are connected to the desired device Choose Disconnect to end connection with the sensor o WDSS Choose Wireless Device Setup WDSS from the Sensors menu in LabQuest App to scan for select and configure Wireless Dynamics Sensor Systems WDSS If no WDSS units are found tap Scan to search for WDSS sensors again The scan may take 20 to 30 seconds and may have to be repeated several times t...

Страница 26: ...If this feature is grayed out in the menu then the data for that particular sensor cannot be displayed in another set of units Calibrate Most sensors use a custom factory calibration identified by LabQuest However some sensors do require calibration and you will use the Calibrate tool accessible from the Sensors menu Follow the detailed calibration instructions provided in the sensor booklet avail...

Страница 27: ... and will surround some but not all of the points with a mark e g a circle or triangle You can easily identify a trace by the corresponding mark in the graph legend Select the checked box to disable this feature The Connect Points option connects data points with straight line segments These lines help the eye follow the data trend but in some cases are not appropriate Select the checked box to di...

Страница 28: ...he Graph View You can adjust the graph view in real time during data collection by applying one of the following actions from the Graph menu Graph Options Tap Graph Options to manually adjust graph settings To adjust the graph view change the values in the Left and Right fields for the x axis and y axis Show Graph Choose Show Graph from the Graph menu to quickly jump between displaying one or two ...

Страница 29: ...eft of the Filing Cabinet and select either Run 1 or All Runs In this way you can gather multiple runs for comparison and view just the ones you want Striking and Tagging Data from the Graph Screen To strike or tag data from the graph screen tap on the data point or tap and drag to select a region of data Then choose the desired tool from the Graph menu and the action will be applied to the data S...

Страница 30: ...t The Tangent mode enhances the Examine cursor by adding a tangent line and numeric display of the slope as you tap different locations on the graph Integral The Integral tool numerically integrates graphed data Select a region if needed and choose Integral from the Analyze menu Enable the tool by tapping on the displayed sensor or column name The integral is drawn and the numeric result is displa...

Страница 31: ...nd display the curve on the Graph screen To exit the Curve Fit tool without applying the curve tap Cancel TIP The RMSE root mean square error is a measure of how well the fit matches the data The smaller the RMSE the closer the data are to the fitted line The RMSE has the same units as the y axis data Interpolate Once you have performed a curve fit you can use the Interpolate tool to read values f...

Страница 32: ...ayed in a separate graph that can be analyzed Tap OK to return to the main graph The peak frequency will be displayed on the graph legend The FFT tool is typically used when analyzing Microphone data For more information see www vernier com til 2310 o Peak Integration This tool calculates the integral for a selected portion of a graph It is most commonly used with the Vernier Mini GC but it can be...

Страница 33: ...tector is connected Choose between a new Position or Velocity match In each case LabQuest generates a random target graph for the matching exercise Only the selected graph Position or Velocity is shown You may collect data over the target graph as many times as you like using the Collect button To see a new target graph choose New Position Match or New Velocity Match Remove Match removes the targe...

Страница 34: ...this to delete a manual or calculated column of data Note that you cannot delete data collected from a sensor however you can hide data using the Strike Through Data tool Delete Run If you have stored at least one run using the Store Run tool this option will be available in the Table menu Upon choosing Delete Run tap the desired run name to delete the run You will not be able to delete the last d...

Страница 35: ...ns From the Lab Instructions screen selectable by tapping the Lab Instructions tab students can view select experiment instructions from Vernier lab books LabQuest comes preloaded with over 100 experiments Opening Vernier Lab Instructions From the Lab Instructions screen choose View Lab Instructions from the View menu This displays a list of the lab books with select experiments preloaded on LabQu...

Страница 36: ... most common Windows and macOS formats for reading and writing LabQuest cannot read NTFS or HFS formatted drives To save a LabQuest App file follow these instructions 1 If saving to an SD card or USB flash drive make sure the drive is inserted in the appropriate port on LabQuest It can take several seconds for LabQuest to recognize the drive 2 Choose Save from the File menu This opens a Save As di...

Страница 37: ...those described in Storing LabQuest App Files but choose Export from the File menu instead of Save As You must connect a microSD card or USB flash drive to export a file To open the exported txt file in a spreadsheet program confirm the program s file browser is set to look for all file types Select your text file If you have access to a wireless network with Internet you can email the data file g...

Страница 38: ...nts use Graphical Analysis 4 app to wirelessly connect to the LabQuest 2 using Wi Fi Experiment data are streamed from LabQuest 2 to each student s device Each lab group member performs an individual analysis of the shared data on their device Students can take their data and analysis home for further analysis and lab reports Set Up Data Sharing on LabQuest To set up LabQuest as a Data Sharing sou...

Страница 39: ...work 4 Select a network Existing Network Infrastructure Network To connect to an existing Wi Fi network follow these instructions a Locate the network within the list and tap on the network name to select it If prompted enter your network s passphrase and tap Connect TIP If your network requires additional network authentication information or if you have an enterprise network that requires a netw...

Страница 40: ...est 2 TIP Students can connect to a LabQuest Network with their mobile devices This network will not support access to the Internet The email function of LabQuest will not work with a LabQuest ad hoc network a Select Create Network TIP If you are in an area with several Wi Fi networks you may need to scroll to the bottom of the network list to locate Create Network b Tap the Network Name field and...

Страница 41: ...the Connections app TIP Some Android implementations have trouble viewing and connecting to ad hoc networks These devices require the use of an existing infrastructure network Enable Data Sharing on LabQuest In addition to connecting to a Wi Fi network you will need to set up LabQuest as a Data Sharing Source using the following instructions 1 Launch the Connections app from the Home screen 2 To e...

Страница 42: ...low students to start and stop data collection from their computing device select the check box to enable this feature Tap OK to save the setup Restricting Access to the Connections Setup Once your LabQuest is configured as desired you can set the preferences to restrict access to the Connections setup information This prevents students from inadvertently changing your network and Data Sharing set...

Страница 43: ...s LabQuest from your computer Chromebook or mobile device Access LabQuest 2 Data Using Graphical Analysis 4 1 Connect your Chromebook or mobile device to the same Wi Fi network to which you connected LabQuest 2 2 Launch Graphical Analysis on your computer Chromebook or mobile device 3 From the New Experiment dialog select Data Sharing Discovered Data Sharing Sources will be listed automatically 4 ...

Страница 44: ...your mobile device to the same Wi Fi network to which you connected LabQuest 2 3 On your computer Chromebook or mobile device open a supported browser and enter the Data Sharing Source Address Alternatively if you have a QR code reader on your device you can access this via the provided QR code ...

Страница 45: ...puter or Chromebook to start data collection Transferring Data from LabQuest to Logger Pro 3 or Logger Lite Automatically Transferring Data If you collect data in LabQuest App and subsequently connect LabQuest to a computer then Logger Lite or Logger Pro 3 will automatically detect the presence of the remote data and display a message indicating the data can be retrieved from LabQuest Follow the o...

Страница 46: ...ction settings Choose LabQuest Browser from the File menu then choose Save As Enter a descriptive filename Any data as well as the sensor configuration will be stored on LabQuest as a LabQuest file Any features in the computer file not existing on LabQuest such as embedded images video analysis graph annotations or most calculated columns will be ignored on LabQuest Deleting Data on LabQuest from ...

Страница 47: ... Connections app from the Home screen 3 Tap the Email settings gear to open the Email Configuration dialog box TIP If you are not able to access the Email Configuration dialog box you may need to update the Connections app lockdown settings See Restricting Access to the Connections Setup for more information 4 Verify email is enabled On 5 Enter the email address you want to use with LabQuest TIP T...

Страница 48: ...from LabQuest App to an installed printer choose Print from the File menu Then choose the item that you want to print Graph Table Lab Instructions My Notes or Screen TIP Options for printing Table Lab Instructions and My Notes are not available when those items have no data to print The Print Options dialog box appears where you can choose the installed printer or Print to File option from the dro...

Страница 49: ...ver for your printer For more information on determining which driver you should select see www vernier com til 3657 Troubleshooting Even if a driver is found printing may still fail due to an incompatible printer If you are sure that the printer is compatible and you are still getting an error it may be caused by one of the following conditions out of paper out of ink toner a door on the printer ...

Страница 50: ...board for class demos or sharing Monitor student progress on any LabQuest connected to your network Create screenshots of the LabQuest screen to copy and paste into lab instructions Set customizable permissions that permit viewing without control or password protect a connection System Requirements Windows Windows 7 SP1 Windows 8 Windows 8 1 and Windows 10 macOS macOS X 10 8 or newer iPad iOS 8 or...

Страница 51: ...t 2 User Manual 45 3 Tap the Viewer settings gear to open the Viewer Settings dialog box 4 Enable LabQuest Viewer On 5 Select the check box to Allow screen control 6 Tap OK to exit the LabQuest Viewer settings ...

Страница 52: ...erator to launch this app The function generator is used to create waveforms in the audio frequency range Select a waveform frequency and volume for each channel Start and stop using the buttons at left The link between left and right channels is on by default so that both channels start and stop together Tap the link icon to control the channels independently Use the sliders to also control frequ...

Страница 53: ... Amplifier to the LabQuest audio output Select the desired output AC or DC DC output levels are limited to 0 2 V steps AC waveforms include sine square sawtooth and ramps Select an amplitude and frequency using the controls The frequency can be changed by factors of two using either the buttons or in small steps using the slider Start and stop the output using the control at left Calculator From t...

Страница 54: ...lip tap the record button To stop tap the square red stop button Play the clip back using the green play button Tap the disk button to save the clip which can later be opened using the open file folder icon The blank page icon clears out any current audio clip TIP Use Sound Recorder to quickly make audio notes on experiments Stopwatch From the Home screen tap Accessories and then tap Stopwatch to ...

Страница 55: ...ensor 14 000 21 000 samples 10K samples s 2 or more sensors 12 000 14 000 samples 10K samples s Minimum Sampling Rate 0 00125 samples s 800 s sample Environmental Durability Operating Temperature 0 45 C Storage Temperature 30 60 C Splash resistant Rugged enclosure designed to withstand a fall from lab bench Size and Weight Size 8 8 cm 15 4 cm 2 5 cm Weight 350 g Ports 5 sensor channels USB port fo...

Страница 56: ...through periodic saving of a backup file Battery life depends on the sensors and features used To optimize day to day battery life set the screen brightness to the minimum acceptable level and turn off LabQuest when it is not in use Also disconnect any sensors you are not actively using To access power saving options tap Preferences on the Home Screen then tap Light Power The long term life of the...

Страница 57: ...tion To calibrate the screen tap System on the Home screen Then choose Calibrate Screen Follow the on screen instructions for tapping the plus sign with the stylus If you are unable to access the Calibration tool press and hold the Home hard key the center of the three hard keys located to the right of the screen until the Calibration tool is displayed Getting Additional Help For access to user ma...

Страница 58: ...te the previous entry use the Backspace key To start a new line use the Carriage Return Note that the spacebar is located to the right of the letter m Numeric and special characters To access the numeric keyboard from the standard keyboard tap Symbols To access symbols from the numeric keyboard tap Special characters To access Greek characters superscripts subscripts and additional operators from ...

Страница 59: ...averton OR 97005 USA Source code will be made available for download or you may request a CD ROM of the code A shipping and handling fee will be charged for a CD ROM The exact terms of GPL LGPL and some other licenses are provided to you with the source code distribution You may also read the license at www gnu org licenses Appendix E Warranty Vernier warrants this product with the exception of th...

Страница 60: ... with this compact and affordable station www vernier com lq2 crg LabQuest 2 Lab Armor Add extra protection from spills and falls www vernier com lq2 armor LabQuest Battery Boost 2 With the added power of an external battery data can be collected for extended periods in the field where AC power is not available www vernier com lq boost2 LabQuest 4 GB SD Card Easily add storage to your LabQuest or ...

Страница 61: ...ble is included with each LabQuest 2 www vernier com cb usb mini LabQuest USB C Computer Cable LabQuest to computer USB C cable The cable has a USB mini B plug and USB C plug This cable is recommended for computers and Chromebook notebooks that only have USB C ports www vernier com cb usb c mini Replacement Battery for LabQuest 2 Replacement high capacity rechargeable lithium ion battery for the V...

Страница 62: ...2 8 5 Revised May 2019 Logger Pro Logger Lite LabQuest Connected Science System LabQuest Viewer Go Wireless Go Direct Graphical Analysis and other marks shown are our trademarks or registered trademarks in the United States All other marks not owned by us that appear herein are the property of their respective owners who may or may not be affiliated with connected to or sponsored by us ...

Отзывы: