


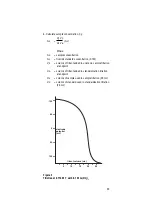


Figure 1
Typical Calibration Curve
In the direct measurement procedure using a pH/mV meter, a
calibration curve is constructed on semilogarithmic paper.
Electrode potentials of standard solutions are measured and
plotted on the linear axis against their concentrations on the log
axis. In the linear regions of the curve, at least three standards
are needed to determine a calibration curve. In the non-linear
regions, more points must be taken. The direct measurement
procedures in this manual are given for concentrations in the
region of linear electrode response. Low-level measurement
procedures are given for measurements in the non-linear region.
12
10
-
5
0.1
180
160
140
120
100
80
60
40
20
0
-20
-40
-60
1
10
100
1000
10
-
4
10
-
3
10
-
2
10
-
1
molarity
ppm fluoride as F
-
10-fold change
electrode
potential
(mV)
~ 56 mV
Содержание 96-09
Страница 7: ...4 ...