Using the Debugger With Microsoft Windows
2-16
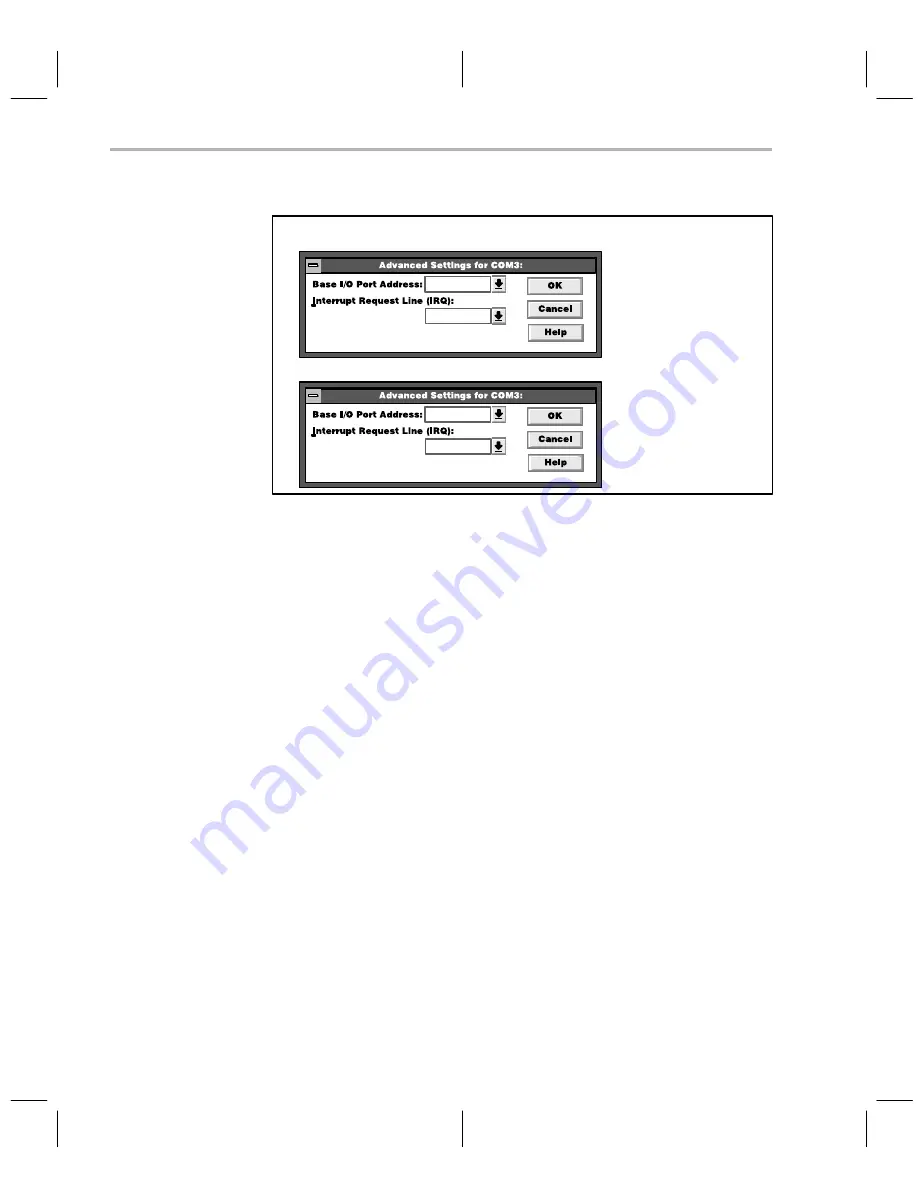
Example 2–1.Examples of Windows COM Port Configuration for Add-on Connections
1) Add-on connection with jumper position COM2
0358
2
0338
3
2) Add-on connection with jumper position COM3
Invoking the debugger with Microsoft Windows
You may want to create an icon to make it easier to invoke the debugger from
within the Microsoft Windows environment. To install the debugger software
in Microsoft Windows, create a new program item. (Please refer to your Micro-
soft Windows manual for details.) While creating a new program item, type
cdt370w.exe at the command line and include any additional parameters you
want. If you plan on using the profiler, be sure to include the
–profile option.
If you prefer, you can also execute the DOS version from Windows by entering
cdt370.exe at the command line. If you are going to be switching frequently
between the basic debugger and the profiler, it might be more convenient for
you to create separate program items for each.
Using Microsoft Windows, you can freely move or resize the debugger display
on the screen. If the resized display is bigger than the debugger requires, the
extra space is not used. If the resized display is smaller than required, the dis-
play is clipped. Note that when the display is clipped, it can’t be scrolled.
When running Microsoft Windows, you should run it in either the standard
mode or the 386 enhanced mode to get the best results.
Содержание CDT370
Страница 2: ...Printed in U S A October 1993 reprinted July 1995 2656911 9761 revision B SPNU133 ...
Страница 14: ...1 4 ...
Страница 36: ...2 22 ...
Страница 44: ...3 8 ...
Страница 52: ...5 2 ...
Страница 54: ...6 2 ...
Страница 70: ...8 10 ...
Страница 76: ...9 6 ...
Страница 78: ...10 2 ...
Страница 82: ...Index 4 ...


