126
Chapter 9: Parametric Graphing
09PARA.DOC TI-86, Chap 9, US English Bob Fedorisko Revised: 02/13/01 2:27 PM Printed: 02/13/01 3:02 PM Page 126 of 8
09PARA.DOC TI-86, Chap 9, US English Bob Fedorisko Revised: 02/13/01 2:27 PM Printed: 02/13/01 3:02 PM Page 126 of 8
Setting Parametric Graphing Mode
To display the mode screen, press
-
m
. To graph parametric equations, you must
select
Param
graphing mode before you enter equations, set the format, or edit window
variable values. The TI
-
86 retains in memory separate equation, format, and window data
for each graphing mode.
The GRAPH Menu
6
E(t)=
WIND
ZOOM
TRACE GRAPH
4
MATH
DRAW FORMT STGDB RCGDB
4
EVAL
STPIC
RCPIC
parametric parametric
parametric
equation window
graph math
editor
editor
menu
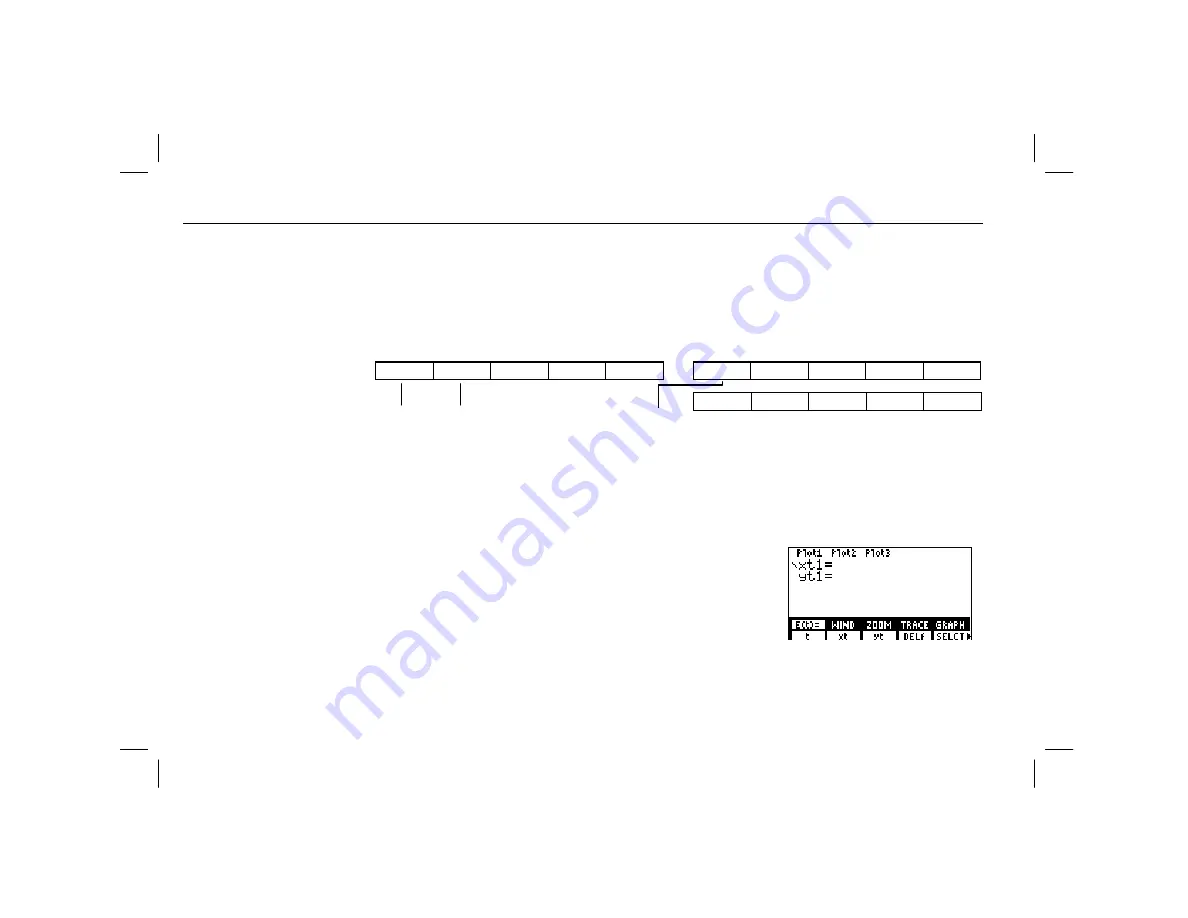
Displaying the Parametric Equation Editor
To display the parametric equation editor, select
E(t)=
from the
GRAPH
menu in
Param
graphing
mode (
6
&
). The equation editor menu displayed on the bottom line is the same as the
Func
-mode equation editor menu, except that
t
and
xt
replace
x
and
y
, and
yt
displaces
INSf
.
In this editor, you can enter and display both the x and y
components of up to 99 parametric equations,
xt1
and
yt1
through
xt99
and
yt99
, if sufficient memory is available.
Each is defined in terms of the independent variable
t
.
Two components,
x
and
y
, define a single parametric
equation. You must define both
xt
and
yt
for each equation.
The default graph style is
»
(line) in
Param
mode.
¾
(shade above) and
¿
(shade below)
graph styles are not available in
Param
mode.
Chapter 5 describes these
GRAPH
menu items:
GRAPH
and
FORMT
.
Chapter 6 describes these
GRAPH
menu items:
ZOOM
,
TRACE
,
DRAW
,
STGDB
,
RCGDB
,
EVAL
,
STPIC
, and
RCPIC
.
A common application of
parametric graphs is
graphing equations over time.


