56
Sidekick
®
Plus Test Set
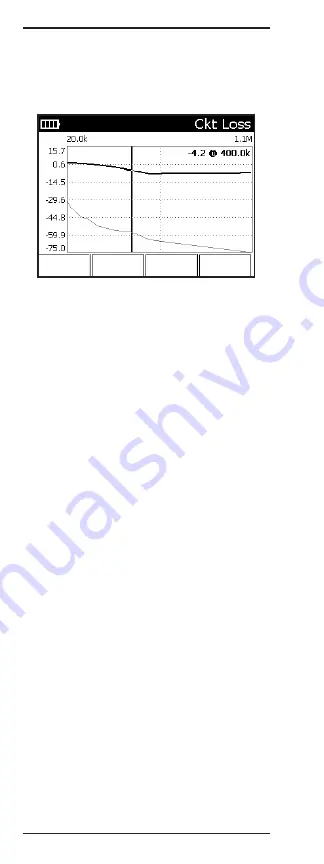
After the test has completed, press
F1 Show Graph
to show the Wideband Slope graph. Use the left (
4
)
and right (
6
) arrows to move the cursor. The Loss and
frequency values are shown in the upper right corner
of the graph.


