


3 – Operating software
DPN 402197 Issue 7.1
© Teledyne Limited
3- 17
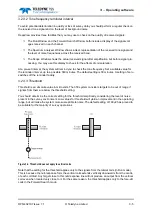
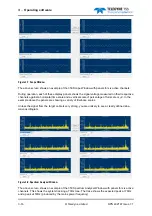
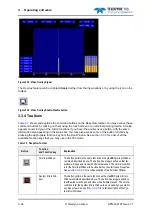
During operation each of these display panels shows the signal voltage measured on their respective
channels against a horizontal time scale and a vertical scale in volts. Note that the vertical scale is
logarithmic: each division represents a 10 times increase in voltage. The frequency axis can be either
25, 50, 100 or 200Hz. Select a suitable axis to allow the tone frequency to be displayed. The data can
be displayed in two formats: either a graph drawn with a continuous line or bars representing the
strengths of each 1Hz band. To change between the two views, press the small graph button to the
bottom right of each graph.
The tone frequency is also shown on the display as a vertical white line. This can assist in adjusting the
tone frequency set in the survey parameters (see
) to that present on the cable. The
threshold is also shown as a horizontal dotted line. In the drawing, this is at the default setting of
100µV.
NOTE
Using and understanding the Spectrum Analyser Window is critical to setting up
and using the 350 system. It allows a check to be made that the tone frequency
can be distinguished from background noise. It also allows the presence of noise
sources to be determined and identified.
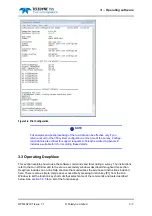
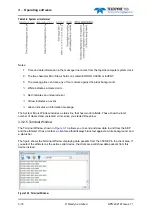
3.3.2.4 System Errors Window
The System Errors Window, shown in
, displays a list of all errors and events reported by the
350 System. The list includes cleared and uncleared errors. The window can include up to 600 lines of
text, with a scroll bar that allows you to search through the list. When the list includes 600 lines of text,
DeepView will delete the oldest message in the list to provide room for any new ones.
Figure 3-9: System Errors Window
The lines of text always have the format described in