Tutorial 9: MPEG-4 and H.264/AVC buffer analysis
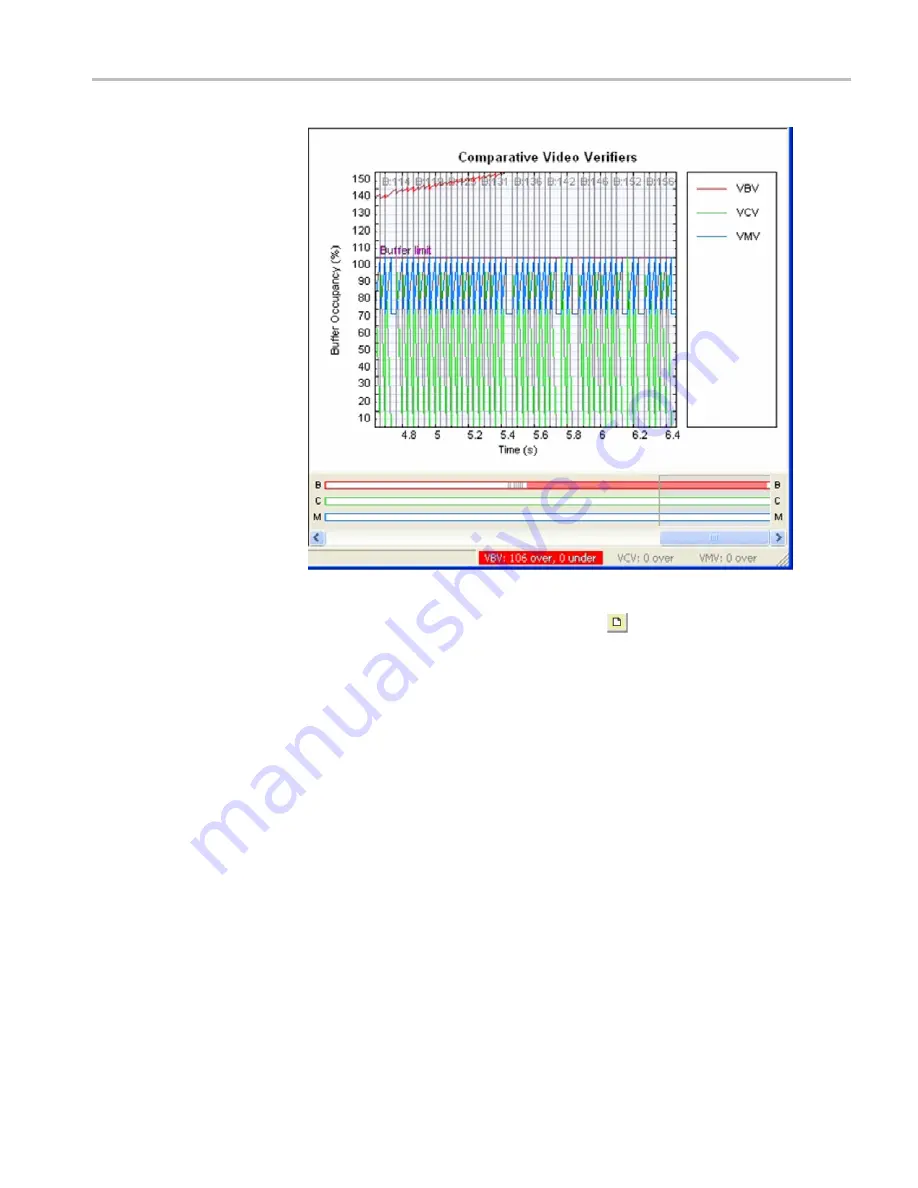
Figure 67: Buffer limit graph
13.
To
fi
t the graph to the window, click the
icon on the
Buffer Analysis
toolbar. The red line displays the VBV over
fl
ow. (See Figure 68.)
MTS4EAV7 HEVC / AVC Video and Compressed Audio Analyzer Tutorials
57


