412-10100
Rev A
54
of 74
6.4.3 Report Setup
Touch the icon to select the Report Setup screen.
This mode allows you to format the statistic reports that are generated for printing or saving as a pdf to a USB
Flash drive.
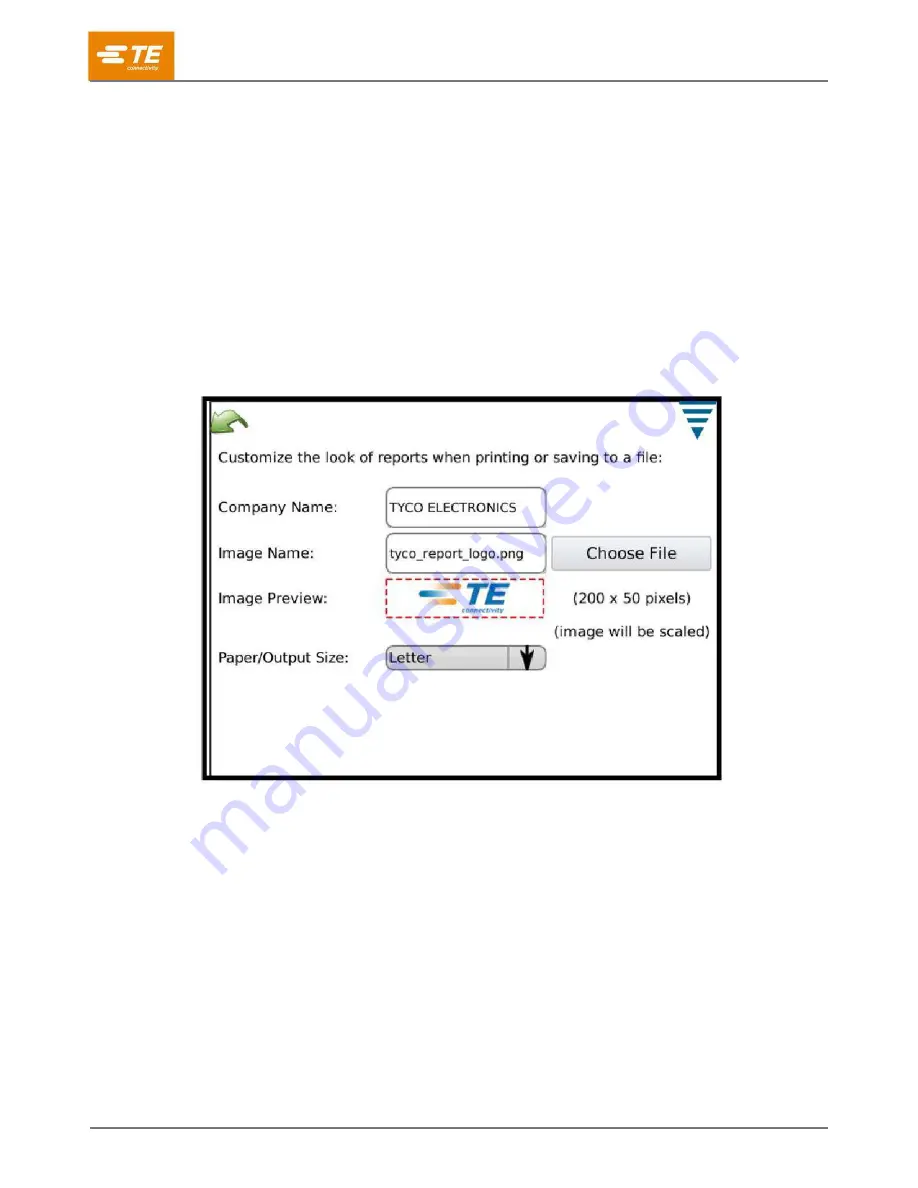
Touch the Company Name and enter the name you choose.
You can import an image, for example your company logo, by touching the Choose File button. The image
must be either a PNG (*.png) or JPEG (*.jpg or *.jpeg) image format. It will be scaled to fit an area that is 200 x
50 pixels. You may need to edit the image first so that it will scale correctly. The image needs to be placed on a
USB Flash Drive before selecting Choose File. After the image is loaded it will be shown in the Image Preview
area.
Choose Paper/Output size to select between Letter or A4 size paper.
Figure 47: Report setup dialog
6.4.4 Curve History Graph
Touch the icon to select the Crimp History Graph screen.
The Crimp History Graph is a diagnostic tool that displays actual raw data curves for both the force and position
sensors. The data is not filtered so a curve may look slightly different from the graphs shown in the other
modes. They are shown displaying the time and date of the crimp. Only the last 50 crimps are available for
viewing. Raw crimp data is lost when power is turned off.
Touch Compare On/Off to display two curves: one red, one black. Use the upper two arrows to change the
black crimp that is showing and the lower two arrows for the red crimp that is showing.
Touch the Save Crimp Curve History button to save data from the 50 Crimp Curves. This is raw data that is
saved in a comma delimited file and is useful for TE personnel to diagnose potential issues with the CQM.


