©Copyright Task Force Tips, Inc. 2002 - 2015
LIN-035 June 16, 2015 Rev15
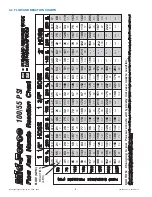
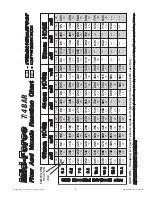
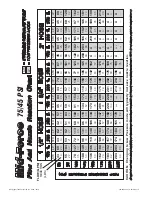
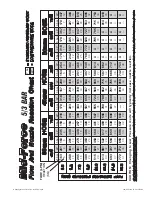
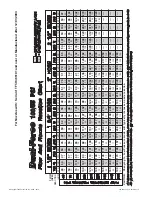
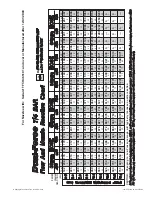
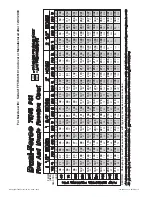
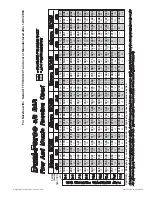
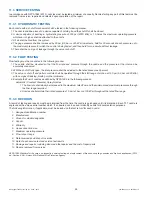
Flow And Nozzle Reaction Chart
CA
UTION:
Changing
to
Low
Pressu
re
mode
will
typic
a
ll
y incr
ease
nozzle
reaction.
45M
45M
45M
60M
60M
60M
75M
75M
75M
3.5
15.5
14.0
12.0
10.0
8.6
7.0
5.2
38mm HOSE
45mm HOSE
50mm HOSE
5 bar
LP
LP
LP
LP
LP
LP
LP
LP
(1) Number
on
top
in each
box indicates flow (LPM), and
number on bottom indicates nozzle reaction (KG).
(2)
In
Standard mode,
the average
nozzle
pressure
is 7
bar
. (3)
Flows
may
vary with
brand
or
condition
of hose. (4)
Flows
are
approximate
and do not
reflect losses
in preconnect
piping.
FL
OW
(LPM)
REACTION (KG)
=
ST
A
N
D
A
RD
PRES
SURE
MODE
= L
O
W P
R
E
S
S
U
R
E M
O
D
E
7 bar
LP
5 bar
5 bar
5 bar
5 bar
5 bar
5 bar
5 bar
5 bar
5/3 BAR
PUMP DISCHARGE PRES
SURE (BAR)
LP
261
394
481
564
628
681
727
772
163
208
295
409
515
613
693
772
6
10
16
23
29
33
37
41
9
15
19
23
27
32
36
40
163
201
273
363
450
522
594
659
235
348
428
496
560
617
659
696
8
12
16
20
23
26
29
33
6
10
15
20
24
29
33
36
216
314
390
450
507
556
606
643
159
193
257
326
401
469
530
587
7
11
14
17
20
23
25
28
6
9
13
18
22
26
29
32
318
458
579
659
723
780
833
---
170
223
344
507
655
780
833
---
11
18
24
29
35
41
47
---
7
11
19
28
35
41
47
---
280
416
515
602
659
715
765
810
167
216
310
447
560
662
761
810
10
15
20
25
30
35
39
44
9
14
18
22
26
30
34
39
254
382
466
549
613
662
712
753
163
208
291
397
500
587
666
742
6
10
15
22
27
32
36
39
318
587
689
772
ó
ó
ó
ó
170
242
462
768
ó
ó
ó
ó
11
24
32
40
ó
ó
ó
---
7
12
25
40
ó
ó
ó
---
367
530
647
727
795
ó
ó
ó
170
235
397
628
795
ó
ó
ó
13
21
29
36
43
ó
ó
---
7
12
22
34
43
ó
ó
---
337
484
613
685
753
810
ó
ó
170
227
367
553
715
814
ó
ó
12
19
25
32
39
45
ó
ó
7
11
20
30
39
45
ó
---
7
12
19
25
31
36
40
44


