8.7 CONTROLLING DEVICES – A QUICK OVERVIEW
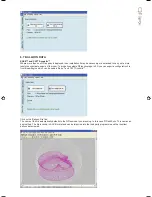
When online the tree menus will show the connected VNET speakers on the network. Double clicking on the model on
the tree view will open the control panel for each respective device. Each open panel will also appear on the tree view
under panels . When online, Podware gathers information from the connected devices. Any parameters which have been
adjusted by the user in previous sessions will be shown.
Each control panel can be positioned on the screen to represent its actual location position in the venue. When saving
data the control panels co-ordinates are also saved so that it appears in the same location on the screen when data is
recalled (see saving & recalling data).
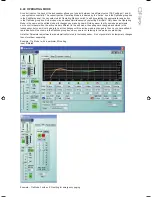
The panels shown on the screenshot allows you to view what is going on inside the VNET product. As well as a mute
button, there is a limiter meter which indicate signal level relative to the limiter threshold setting, input level meter, draw
on the power supply, driver status indicators showing the status of each driver.
The arrow button (>>) at the top right hand side of the control panel will expand the control panel to reveal a host of
parameters which can be viewed & adjusted.
8.8 PARAMETER SYNCHRONISATION
PodWare aims to always ensure that the control settings in the virtual control panel are always a faithful representation of
the settings in the connected device. To achieve this, the parameters in the device are copied to the control panel when
going online. This takes a few seconds to complete (see Communications and
Progress Bar)
. Whilst online, any changes
to the control settings will result in changes in the stored parameters in the devices, thus retaining synchronisation. When
a file is opened online, the new settings are not only set in the control panel; they are also transferred to the device
8.9 PROGRESS BAR
The area in the status bar at the bottom-right of the application window will indicate progress of some operations.
A
coloured bar will extend to fill the extreme right-hand box, indicating progress from 0 to 100%, after which it will
disappear. While in progress, the text to the left of the bar will indicate what operation is being performed. “Loading”
will often be shown to indicate that the data is being transferred between the device and PodWare.
While the Progress Bar is showing activity, it is best not to perform any other actions in PodWare.
8.10 NAVIGATION
The Tree view on the left-hand side of the screen allows you to view the system.
The two main nodes in the Tree are
Devices, listing all the compatible devices found on the network, and Panels, listing all the control panels that have been
launched onto the Layout. Control panels may be launched by double-clicking on, or dragging a Devices node (see
Launching a Panel).
Clicking the ‘-’ on one of the main Tree nodes will close that branch, allowing you to remove some detail from the Tree.
Clicking the ‘+’ will restore the full detail.
Panels will often have navigation buttons for changing the amount of detail seen (and size of the panel). A Monicon panel
will have a ‘>’ button for expanding it into a full control panel. Similarly, a full panel will often have a ‘<’ button for reducing
the amount of detail (and panel size).
8.11 THE SELECTED DEVICE
The “Selected Device” is the device to which operations from the Device menu will be applied, and to which device-
related toolbar button actions (such as Locate, Save, Open) will be applied.
If a device is selected in the Tree view (by clicking on a device node or a panel node so that the text of the node
highlights), then this is the selected device. If no device is selected in the tree, then the control panel in focus (the one
whose colour is different to the others) will be the selected device. If there are no panels in the layout, and no device is
selected in the Tree view, then no device is selected, and device-related operations will not work.
Содержание Qflex
Страница 1: ...u s e r m a n u a l...
Страница 34: ...Input A muted...


