21
1-Channel MCP Detector MCPD25 Manual
1-Channel MCP Detector MCPD25 Manual | Surface Concept GmbH
• Increase the operation voltage in steps of 50V until far above the last operation voltage (please respect
the recommended maximum operation voltage) or until the detector shows significant artefacts.
Measure the count rate for each voltage step.
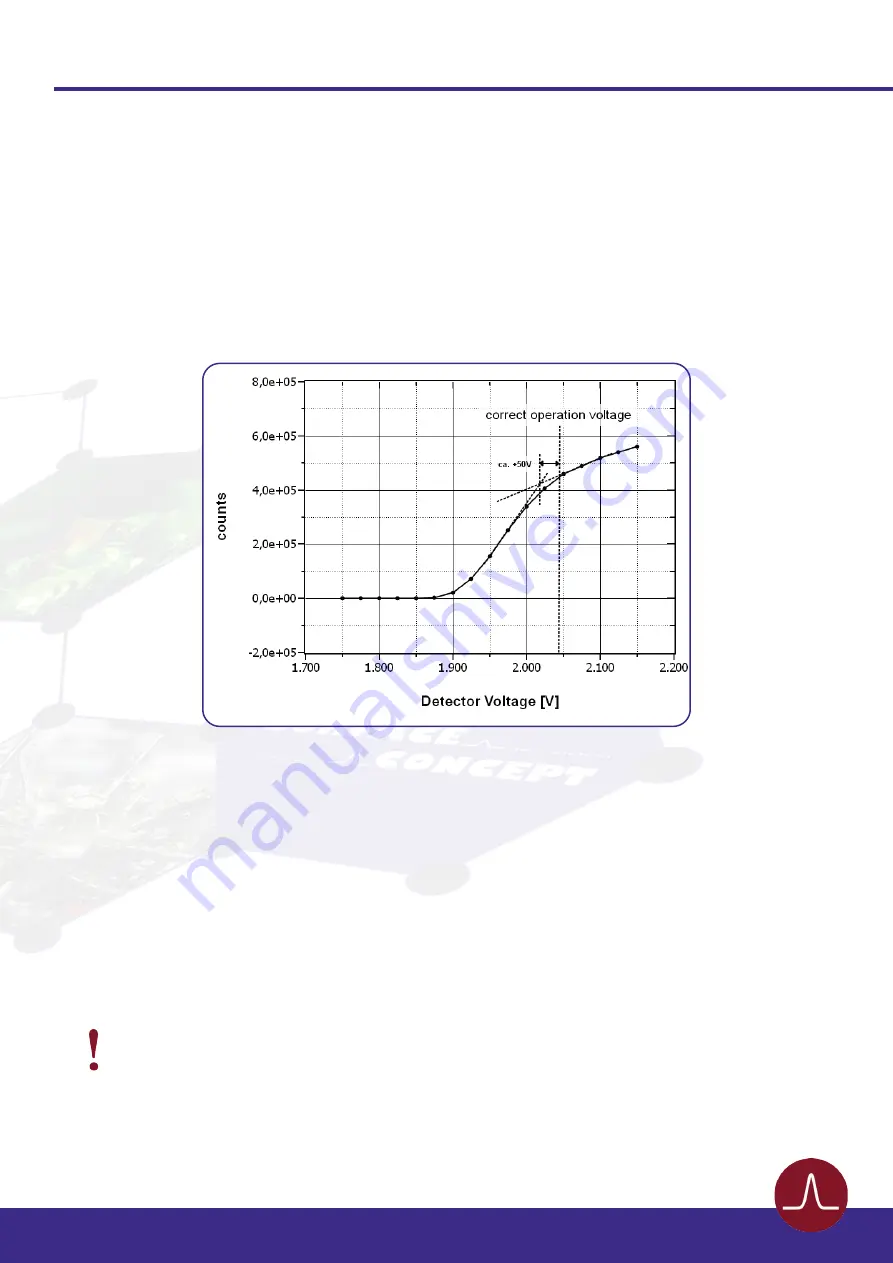
• Plot the measured count rate as a function of the operation voltage. This is the MCP curve. It should
show a change in the slope of the rising curve, which indicates the beginning of the area of operation.
shows an example of a MCP curve with the specified operation voltage. The MCP curve for
specifying the starting operation voltage for a detector can always be found in the specification sheet.
Figure 8: Example of MCP curve (for illustration only).
The life time of MCPs can be very large, due to the high stability of the operation performance over a
large amount of extracted output charges after the burn-in period. The main reason for an often much
shorter operation time of the MCPs is an inhomogeneous irradiation of the MCPs. This is connected to a
locally (strong) different gain degradation, which results in an inhomogeneous detector response. Locally
different gains can still be compensated by increasing the operation voltage, but very often the increasing
voltage step must be much larger to reach again a homogeneous detector response.
Gain degradation also depends strongly on the environment in which the MCPs are being operated. Care
should be taken to prevent exposure to high concentrations of hydrocarbons and halogens. Also prevent
MCP operation at higher temperatures (> 50°C, e.g. respect an appropriate cooling phase after bake out).
Strong inhomogeneous irradiation of the MCPs lead to strong locally different gain
degradation and to an inhomogeneous detector response, which is the main reason for
a shortened operation time of the MCPs.
Note


