


Using Solar-Log WEB
Solar-Log
1000
User Manual
77 of 131
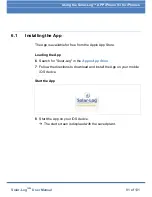
5.3.6 Overview of all years
Select
Overview all years
in the navigation bar.
The individual annual yields are shown as a total in a bar graph. The
dark green line shows the target value for the year. For the current year
two green lines are shown:
The top line shows the annual target.
The bottom line shows the annual target accumulated to the present
day.
3
Move the mouse over a year bar.