


Operation using the web browser in your own network
16 of 131
Solar-Log
1000
User Manual
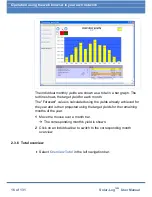
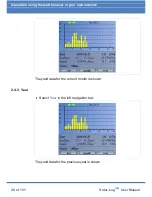
The individual monthly yields are shown as a total in a bar graph. The
red line shows the target yield for each month.
The "Forecast" value is calculated using the yields already achieved for
the year and is then projected using the target yields for the remaining
months of the year.
1
Move the mouse over a month bar.
The corresponding month's yield is shown.
2
Click on an individual bar to switch to the corresponding month
overview.
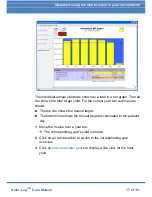
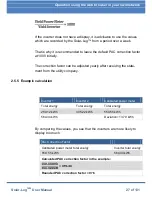
2.3.6 Total overview
Select
Overview Total
in the left navigation bar.