17
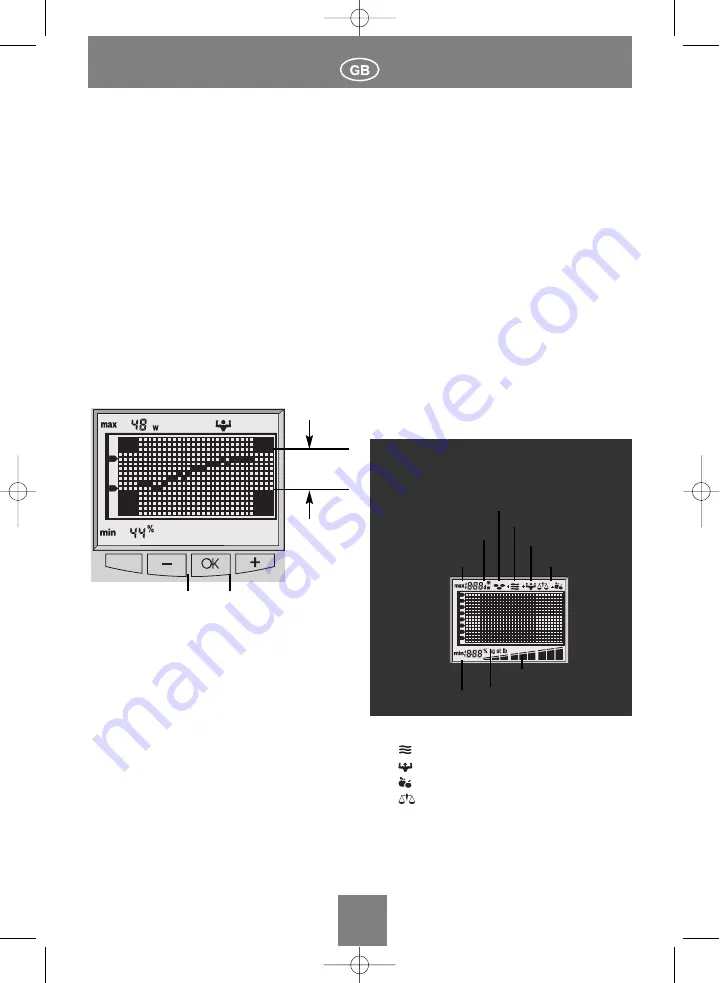
Trend display
Note that regular use of the scale will
improve the accuracy of the trend readings.
The trend curve can indicate 31 different values, pro-
vided the corresponding number of measurements
has been carried out.
If several measurement operations are carried out
per day, a single average value is saved.
7 daily readings are used to determine a weekly
average.
4 weekly values produce the monthly average.
Note that regular use of the scale will
improve the accuracy of the trend readings.
The normal range calculated for each person is
shown in the trend display by the range between
the fields in the corners.
Changing the trend display to a different
value
In addition to the display of total weight, you can
also have the proportions of body fat, body water
or muscle relative to total weight (%) displayed -
in time intervals of days, weeks or months.
The trend display can be changed to another mode
without loss of previous measurement data.
The measurement readings are saved:
During a battery-change
If the default age setting is increased by one year
(to account for user’s birthday)
If body height is increased (to allow for growing
children)
All other changes to the person-specific param-
eters will clear the data kept in the correspon-
ding memory.
Normal range
Normal-
range
Maximum value
Unit
Body fat
Body water
Muscle proportion
Recommendation
*
Minimum value
Trend display
Day - Week - Month
Symbols
Status indicator
* Meaning of the symbols:
+
You should drink more!
+
Muscle-building training is recommended!
+
Change of diet recommended!
+
Your analysis figures are fine!
BA_63711_neu_V8.qxd 18.01.2006 13:53 Uhr Seite 17


