


User Guide (Version 2.2) of the
SiRad Simple® Evaluation Kit
- 21 -
Figure 22: 2D view of the FFT data
Figure 23: 3D view of the FFT data
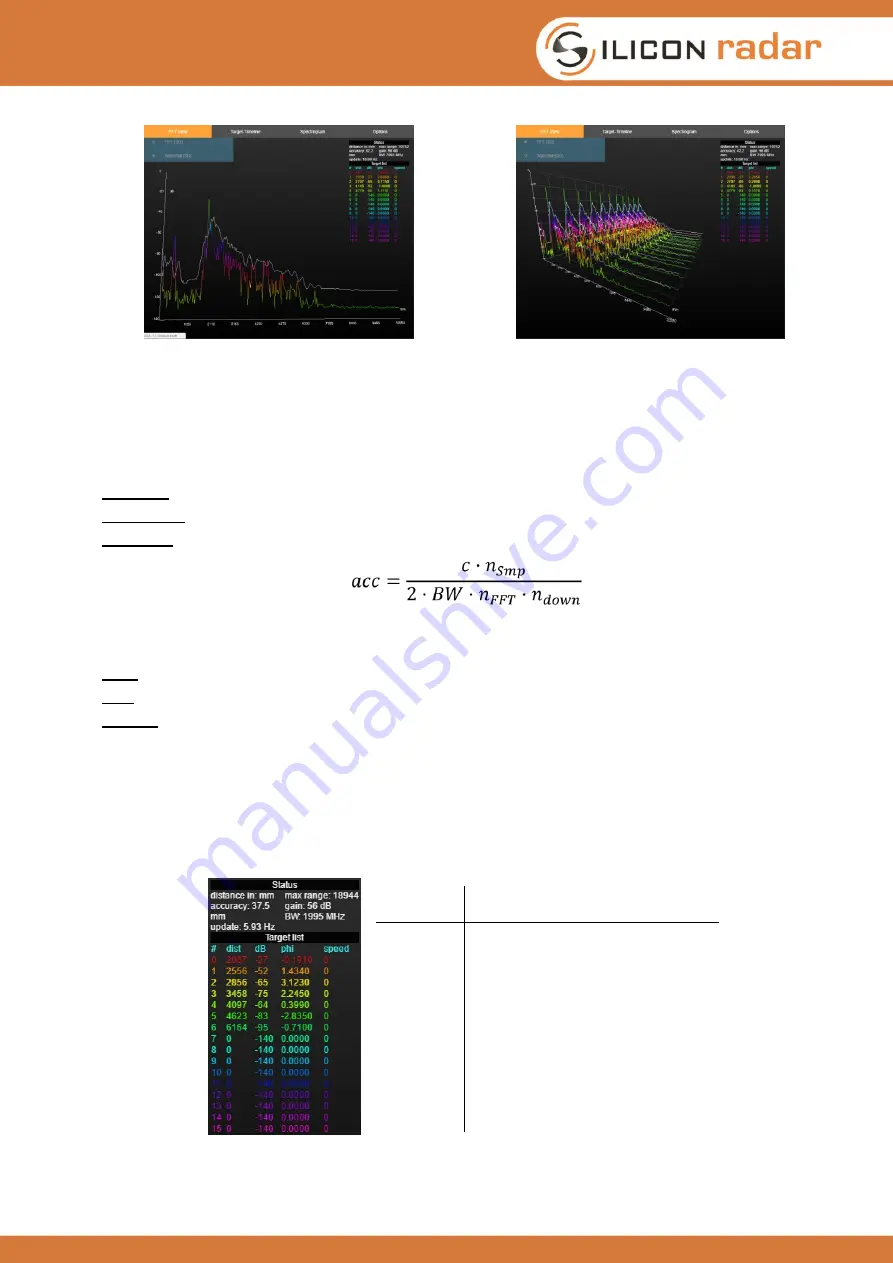
3.3.2 Status Field and Target List
The ‘Status’ field shown in Figure 24, top, displays a couple of useful information about the current
measurements.
distance
: shows the used distance format of the sensor, for example, [mm, cm, bins].
max range
: current maximal measurement range of the sensor in the chosen distance format.
accuracy
: the width of one distance bin of the sensor after the formula
where
c
is the speed of light,
BW
is the bandwidth,
n
Smp
is the number of samples,
n
FFT
is the FFT
size, and
n
down
is the downsampling factor.
gain:
current gain setting of the baseband amplifier in dB.
BW:
the chirp’s bandwidth.
update
: calculated update rate from the TSLM-value („time since last measurement“).
The ‘Target list’ shown in Figure 24, bottom part, is ordered by distance. With every new
measurement having the CFAR operator enabled, the ‘Target list’ is updated. Where the distance
bin crosses the CFAR threshold from below, the local maximum is searched and a target is
generated. If two or more target peaks cross the CFAR threshold from below before the distance
bin goes back underneath the CFAR threshold, only the first target is marked.
Target list
column
Description
num
indicates the number of the target
dist
the distance of the target in the
selected format
db
magnitude of the target peak
phi
phase angle of the target, meaning the
phase shift between the outgoing wave
and the incoming wave; the value
should change rapidly, if the target is
moving
speed
radial velocity of the target [m/s]
calculated as a distance difference
since the last measurement
Figure 24: Target list with the status field at the top