


User Guide (Version 2.2) of the
SiRad Simple® Evaluation Kit
- 20 -
3.2.8 Radar Hardware Information (System Info Tab)
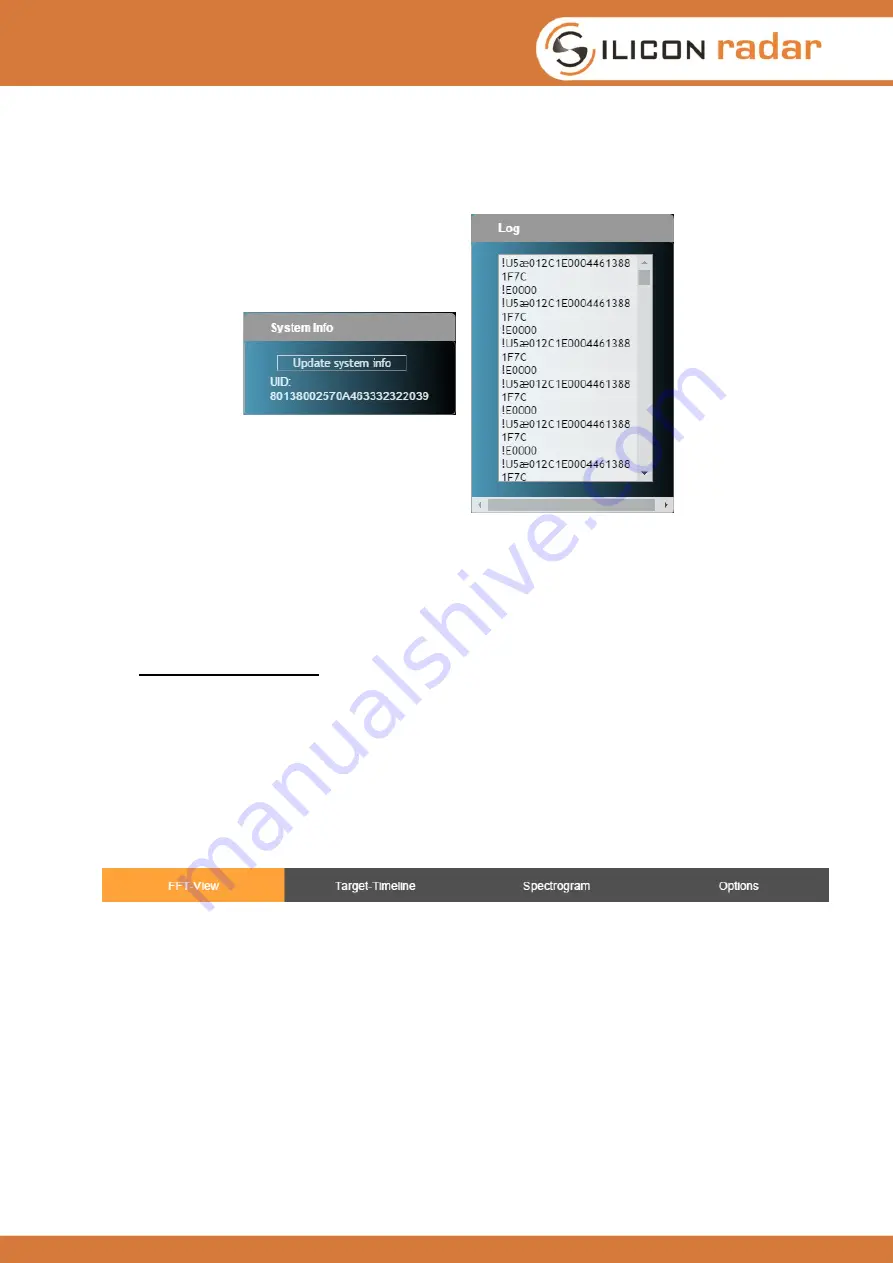
The ‘System Info’ tab in Figure 20 (left) shows the unique hardware identification number of the
sensor. You can press the ‘Update system info’ button to refresh this information from the sensor.
Figure 20: System Info tab (left) and Log tab (right) of the Control Panel
3.2.9 Recently Sent Control Frames (Log Tab)
Figure 20 (right) shows the Log tab which lists the latest control frames sent to the sensor. Also see
the Protocol Description for further information about the sensor’s communication protocol.
3.3 Using the Main Menu
The main menu is shown in Figure 21. Here you can select how the data should be displayed. You
have the following main options, which are explained in the following subsections:
FFT-View: FFT (2D) and Waterfall (3D)
Target-Timeline
Spectrogram
Options
Figure 21: Main menu of the WebGUI
3.3.1 FFT View
FFT (2D) chart (Figure 22)
:
The x-axis shows the distance and the y-axis shows the magnitude in dB at this distance.
Waterfall (3D) chart (Figure 23)
:
In the 3D view you can see the history of data, with the z-axis being the timeline. Older values
move to the back (higher z-values). The x and y-axes behave like in the 2D view.