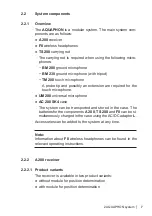
2 AQUAPHON system │
13
Audio player
The
Audio player
button displays the following information for
the most recent measurements:
●
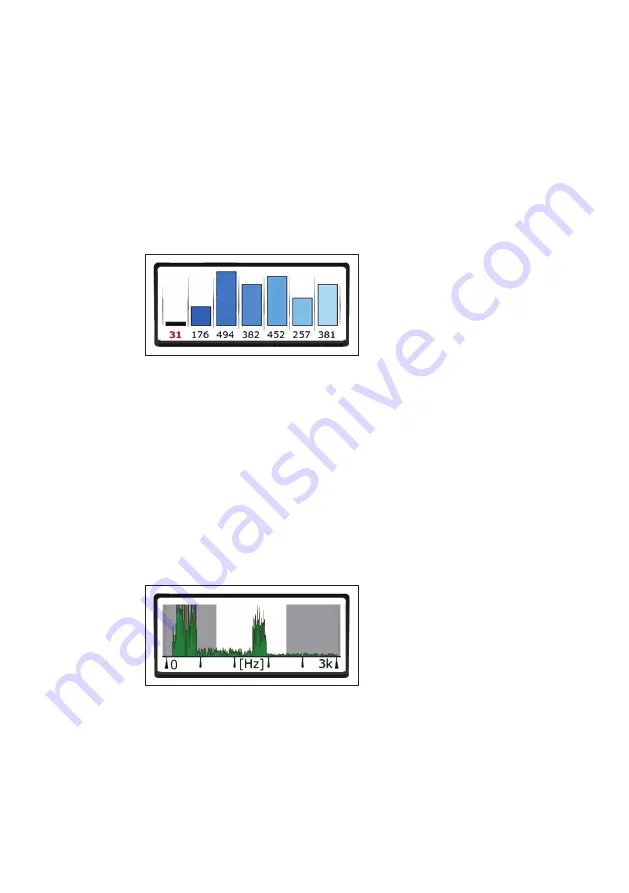
Measurement value
The measurement value is displayed as a numeric value and
a bar.
Up to seven measurements are shown. The current measure-
ment appears on the left and the oldest measurement on the
far right.
Fig. 8:
Audio player
button
The
Audio player
menu is opened using the
Audio player
but-
ton. The following actions can be performed in this menu:
●
Play back, delete, save noise
●
Load and play back noise from the memory
●
Display information about a measurement
Filter
The Filter button displays the following information:
Fig. 9:
Filter
button during a measurement
(frequency graph appears in green)
● Frequency graph of the current noise
−
When there is no measurement ongoing:
All frequencies are displayed. The frequency graph appears
in light blue.

