


47 |
P a g e
R e v 5 - 1 9
Probe Drop-down menu: Selector used to choose between probes.
Layer Drop-down menu: Selector used to choose between layers.
If the run selected was defined as a 2-layer recipe at the time of the run, then you can select, analyze
and modify each layer individually. SA Analysis Tool can analyze up to 2 layers at the same time with the
SpecMetrix Measurement System.
If a defined line has more than one probe that has had analysis (Debug) readings taken, you can select
which probe analysis data you wish to review.
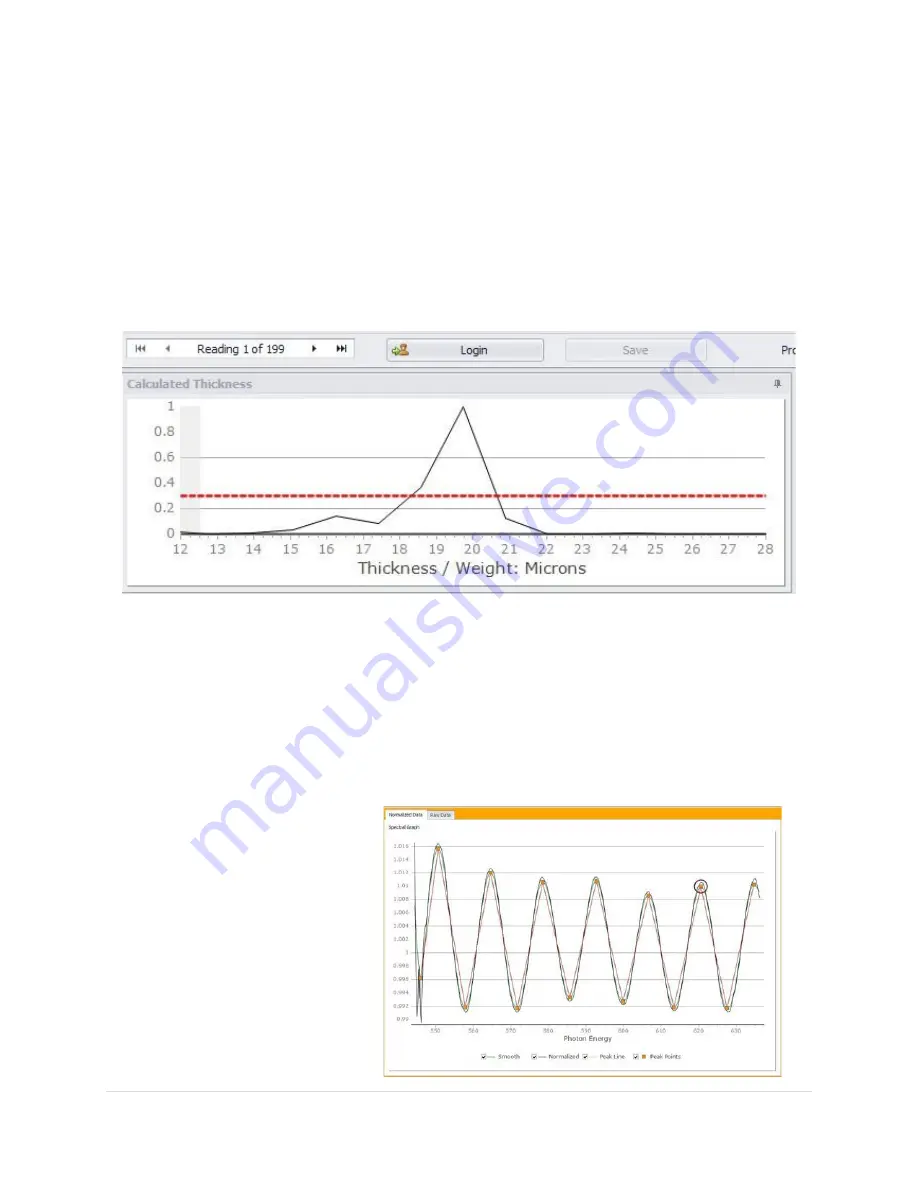
Calculated Thickness
A Peak graph that shows the thickness or film-weight peaks within the Min/Max evaluation range.
On a scale of 0.0 to 1.0 (0 to 100%), the y-axis of this graph shows the normalized probability of the
thickness/weight for the particular measurement. Unless measuring a multi-layer material, there should
only be one obvious peak. Multiple peaks usually occur when there are multiple layers or when there is
“noise” present in the light signal. This optical noise can be caused by the scattering of light hitting solid
particles in the coating, when the light hits a material with a rough surface, or improperly focused
probe.
Changes to the PA Settings or Layer Settings section will have an impact on the peak graph.
Normalized Data
The Spectral graph displays the
normalized reflectance used to
calculate the thickness of a
coating/film across a wavelength
range.