Отзывы:
Нет отзывов
Похожие инструкции для 9816B

C61
Бренд: Fantini Cosmi Страницы: 8

CC-405
Бренд: Huber Страницы: 94

Microline OCD2
Бренд: OJ Страницы: 8

Professional NT100e/h
Бренд: Proliphix Страницы: 100

20250-32
Бренд: Digi-Sense Страницы: 8

33CS420-01
Бренд: Carrier Страницы: 89

GCW03MR001SE
Бренд: Seitron Страницы: 16

Raychem TCON-CSD/20
Бренд: nvent Страницы: 72

1760/IR800
Бренд: Beta Страницы: 108

307P
Бренд: Leadshine Страницы: 2

TROPICANO 2000
Бренд: Taurus Страницы: 12

Pronto Plus HI99551 Series
Бренд: Hanna Instruments Страницы: 8

LCD Thermometer
Бренд: Hama Страницы: 46

QAA55
Бренд: Ideal Heating Страницы: 8

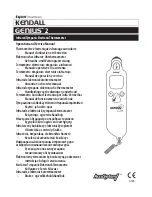
GENIUS 2
Бренд: kENDALL Страницы: 16

PT200S
Бренд: Pacer Страницы: 2

PT2000
Бренд: Pacer Instruments Страницы: 5

IR-710
Бренд: Amprobe Страницы: 76


