


SARK
SARK
SARK
SARK-
-
-
-110
110
110
110
User’s Manual
Rev 1.2.6 October 3
rd
, 2015
- 60 -
© Melchor Varela – EA4FRB 2011-2015
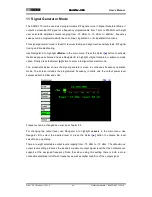
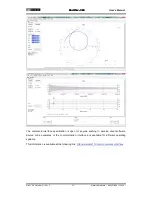
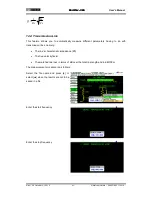
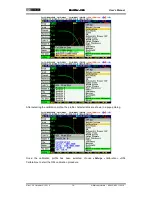
After some seconds the results are
shown on the screen.
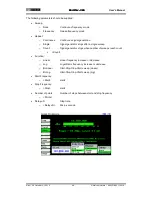
A screenshot can be captured by
selecting [
●
]
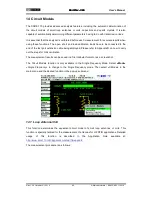
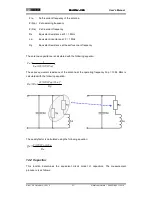
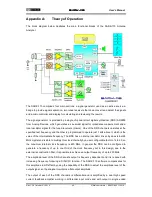
The figure below describes the measured parameters:
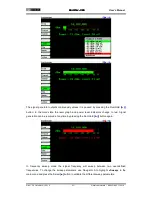
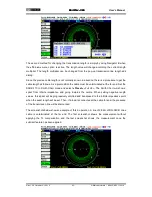
The process starts by searching for the series and parallel resonant frequencies. The start scan
frequency is taken from the specified frequency value. The scan range is +1 MHz up and -1 MHz
down from this value.
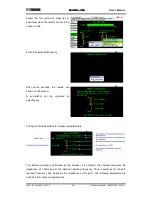
The resonant frequencies are identified in the singularities where the impedance changes from
pure capacitive (phase value close to -90º) to pure inductive (phase value close to +90º). The
resonant frequencies are then obtained from the frequency points where the measured phase
value is close to zero.
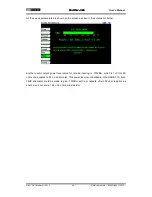
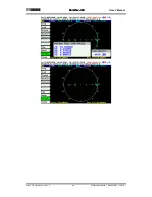
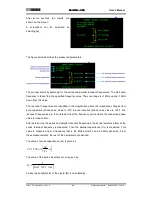
After determining the series and parallel resonant frequencies, the series resistance (Rs) at the
series resonant frequency is measured. Then the parallel capacitance (Co) is measured. This
value is measured from a frequency that is 2.5 MHz below Fs and 2.5 MHz above Fp. From
these measurements, the rest of the parameters are derived:
The value of series capacitance (Cs) is given by:
−
×
×
=
1
2
Fs
Fp
Co
Cs
The value of the series inductance (Ls) is given by:
(
)
Cs
Fs
Ls
×
×
×
=
2
2
4
1
π
Finally, the quality factor of the crystal (Q) is calculated by:


