20 S&C Instruction Sheet 1022-540
Viewing Data Logging
Date and Time
This is the date and time when the switching operation occurred.
Request Type
This is the type of request (manual, voltage override, etc.) that caused the bank to switch.
View the Power Outages Log
The
Data Logging: Power Outages
screen shows the date and time of the last 15 power cycles.
To display the
Data Logging: Power Outages
screen, click on the
Data Logging
button.
Then, click on the
Power Outages
button.
This log can hold information for 15 power failures and 15 power restorations. When the
log is full, each new event over-writes the oldest event in the log. To find the most recent
event, look for the message with a timestamp older than the time for the message above it.
View the Data Graphing Screens
The
Data Graphing
screens provide quick access to historical data displayed as graphs.
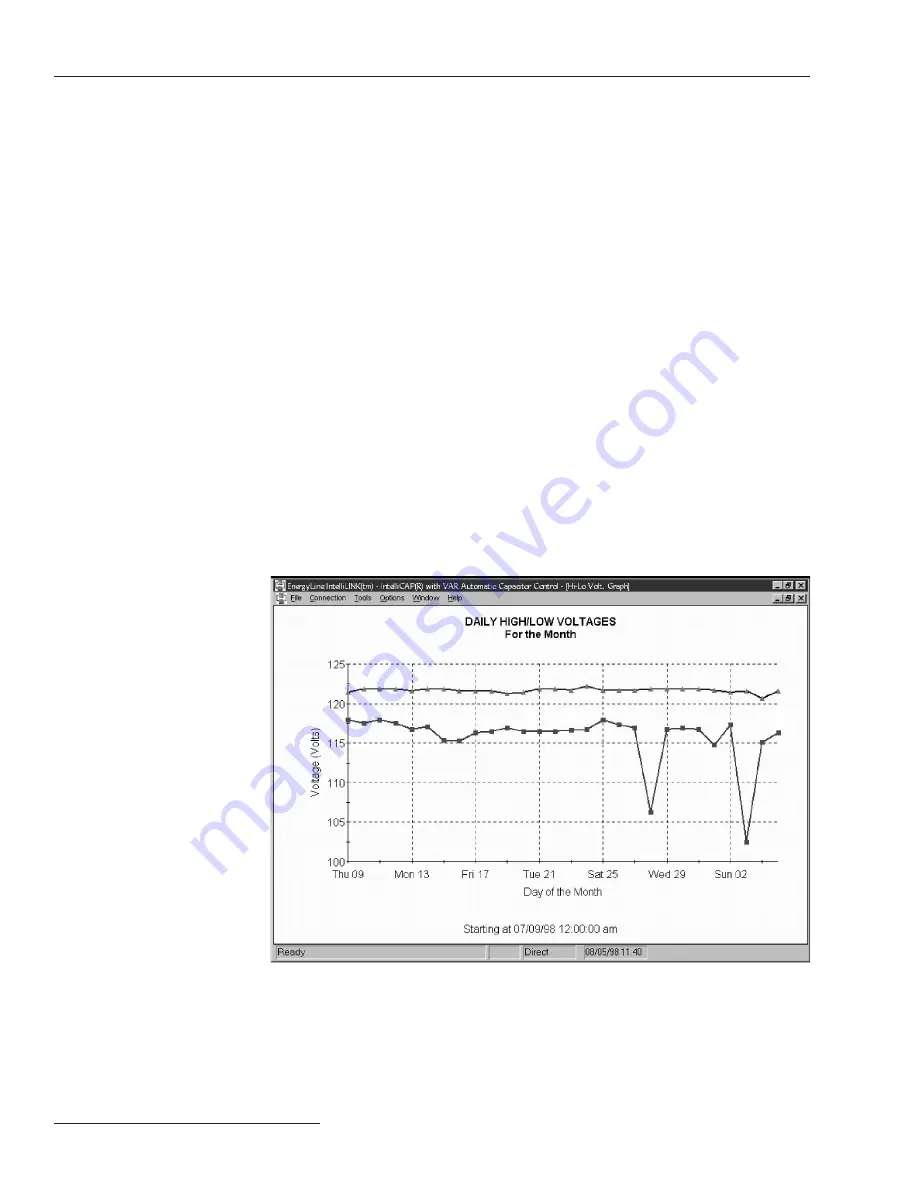
The control automatically scales each graph to show as much detail as possible. Graphs are
available for daily highs and lows for the last month and for sensor profiles.
Follow these steps to display daily highs and lows:
STEP 1.
Click on the
Data Graphing
button.
STEP 2.
Click on the
Daily High-Low
button.
STEP 3.
At the
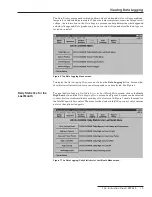
Data Graphing: Daily Statistics for Last Month Menu
screen, click on the
button for the type of data to be viewed. The IntelliLink software reads the
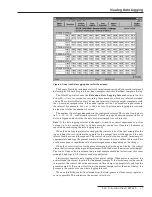
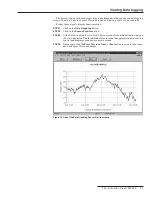
appropriate data from the control and displays a graph as a separate screen. See
Figure 9.
Figure 9. One of the Data Graphing: Daily Statistic screens.
Data Graphing

