21
Chart View
Tap the Chart tab on the bottom navigation bar to display all historical data taken from your Sakar devices in
Chart format.
NOTE: The top tab options not available for your selected Sakar device will be inactive.
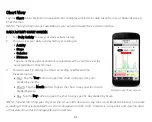
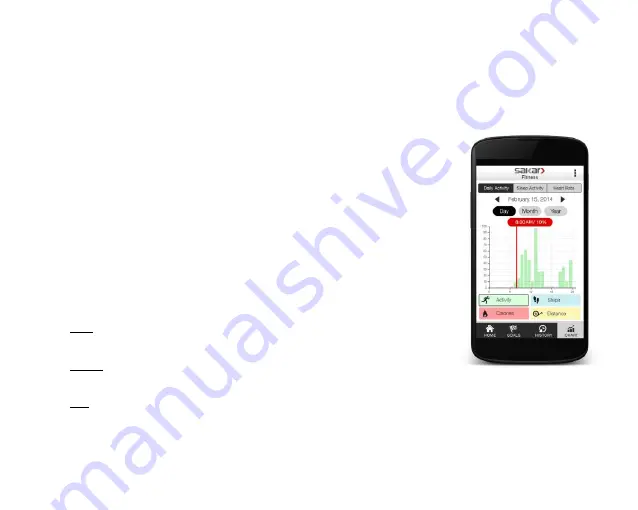
DAILY ACTIVITY CHART SCREEN
1.
Tap Daily Activity to view your daily activity history.
2.
You can view your daily activity history according to:
Activity
Steps
Calories
Distance
Tap one of these options (buttons located below the chart) to view the
selected data in Chart format.
3.
You can select to display the Chart according to different time
measurements:
Year: Tap the Year button to open the chart in any specific year
divided by months.
Month: Tap the Month button to open the chart in any specific month
divided by days.
Day: Tap the Day button to open the chart in any specific day divided by hours.
NOTE: Tap and then drag your finger on the screen (iOS devices) or tap the screen (Android devices) to activate
a reading of that selected date/time. A red line appears on the chart. Position it at any point and view the data
of that date/time that is displayed above the red line.
Daily Activity Chart Screen


