


Operating the Instrument
R&S
®
RTO2000
75
Getting Started 1332.9719.02 ─ 08
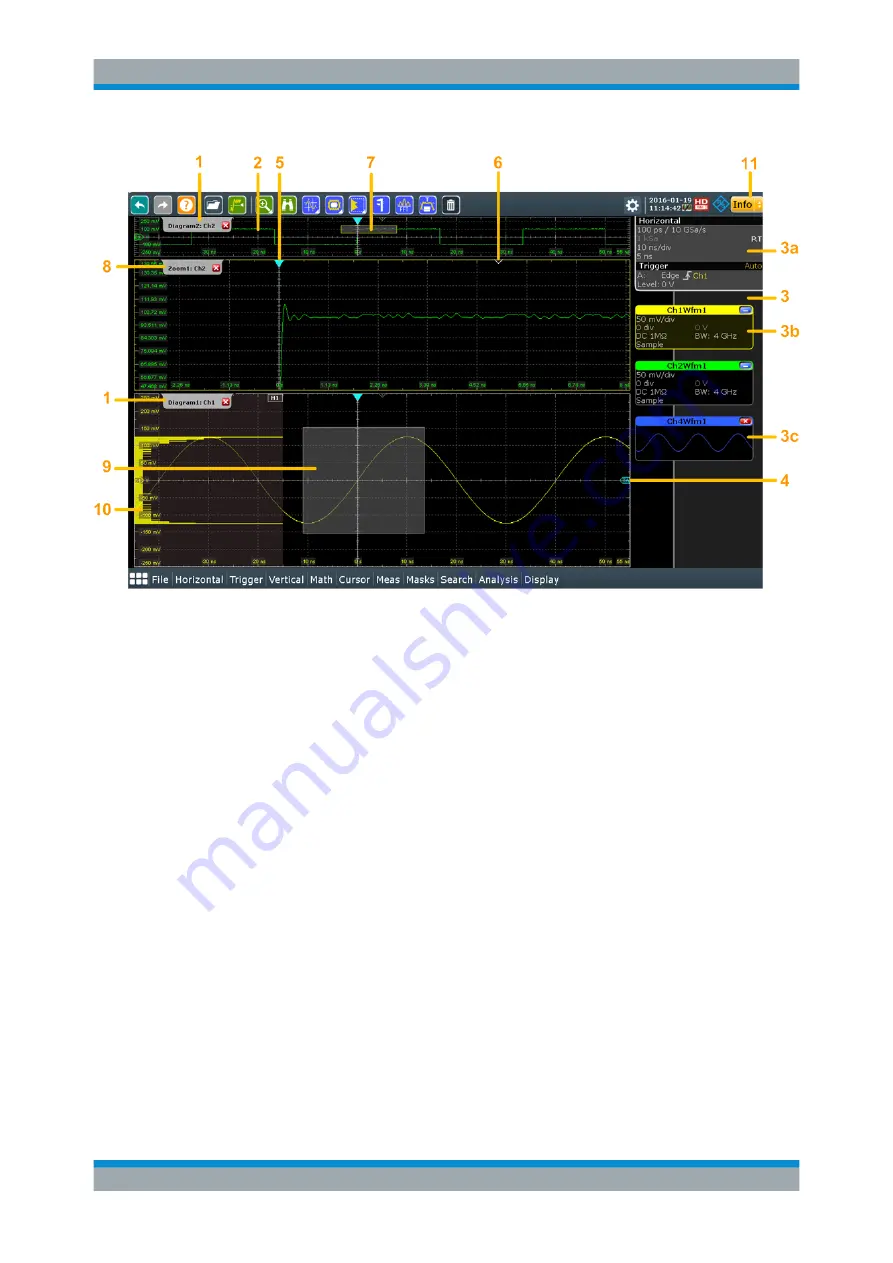
Figure 5-1: Display information
1 = Diagram
2 = Grid
3 = Sidebar with horizontal and trigger label (3a), signal icon with waveform settings (3b) and signal icon
with minimized live waveform (3c)
4 = Trigger level
5 = Trigger position
6 = Reference point (distance from trigger position to reference point = horizontal position)
7 = Zoom area
8 = Zoom diagram
9 = Histogram area
10 = Histogram
11 = Messages
Diagram (1)
A diagram shows one or more waveforms: channel, reference, and math waveforms
together with histograms, masks etc. Zoom details, XY-waveforms, spectra and other
special waveforms are shown in separate diagrams.
By default, the diagram name contains the diagram number and the short names of the
waveforms shown inside. To change the diagram name, touch and hold the tab name.
The on-screen keyboard opens to enter the new name. Names must be unique.
To arrange the diagrams on the screen, the Rohde & Schwarz SmartGrid function
helps you to find the target place simply and quickly. For details, see
on page 82. You can also adjust the diagram size by
dragging the diagram border.
Touchscreen Display
Содержание R&S RTO2000 Series
Страница 1: ...R S RTO2000 Oscilloscope Getting Started Getting Started Version 08 1332971902 P C2...
Страница 6: ...Contents R S RTO2000 6 Getting Started 1332 9719 02 08...
Страница 34: ...Instrument Tour R S RTO2000 34 Getting Started 1332 9719 02 08 Keys and Controls...
Страница 72: ...Trying Out the Instrument R S RTO2000 72 Getting Started 1332 9719 02 08 Saving Data...
Страница 102: ...Setting Up the Instrument R S RTO2000 102 Getting Started 1332 9719 02 08 Adjusting Passive Probes...


