Rohde & Schwarz R&S RTO2000 Series Скачать руководство пользователя страница 53

Trying Out the Instrument

R&S

®

RTO2000

53

Getting Started 1332.9719.02 ─ 08

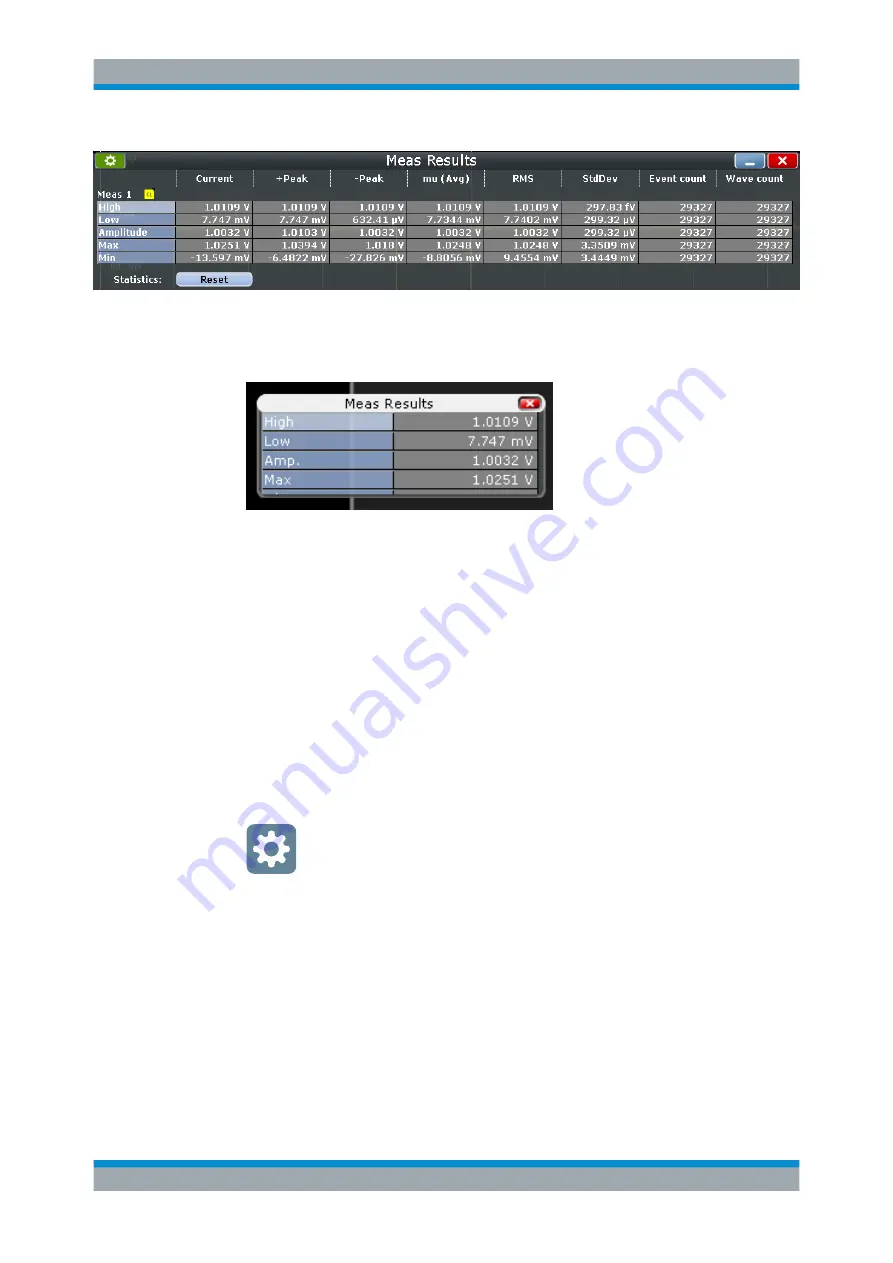
11. To save space in the display, touch the title of the results diagram, and drag it to

the sidebar.

Now you see the results in the result icon.

12. Close the result icon.

4.7.3


Performing and Configuring the Quick Measurement

A set of maximum 8 different measurements on one source can be performed at once,
simply by tapping the "Quick measurement" toolbar icon. You can configure the mea-
surement types to be included in quick measurement. This way, you can repeat mea-
surements quickly.

By default, the "Quick measurement" icon is not visible in the toolbar. Therefore, you
first configure the toolbar content.

To add a function to the toolbar

1. On the right of the toolbar, tap the "Toolbar configuration" icon.

2. Enable "Quick meas".

Performing Basic Measurements

Содержание R&S RTO2000 Series

Страница 1: ...R S RTO2000 Oscilloscope Getting Started Getting Started Version 08 1332971902 P C2...

Страница 2: ...S RTO2064 1329 7002K64 2018 Rohde Schwarz GmbH Co KG M hldorfstr 15 81671 M nchen Germany Phone 49 89 41 29 0 Fax 49 89 41 29 12 164 Email info rohde schwarz com Internet www rohde schwarz com Subjec...

Страница 3: ...ons 10 1 3 3 Notes on Screenshots 10 2 Preparing for Use 11 2 1 Unpacking and Checking the Instrument 11 2 2 Positioning the Instrument 12 2 2 1 Bench Top Operation 12 2 2 2 Rackmounting 13 2 3 Starti...

Страница 4: ...Waveform History 48 4 7 Performing Basic Measurements 49 4 7 1 Performing a Cursor Measurement 50 4 7 2 Performing an Amplitude Measurement 51 4 7 3 Performing and Configuring the Quick Measurement 5...

Страница 5: ...5 7 Using Dialog Boxes 92 5 8 Entering Data 93 5 9 Messages 95 5 10 Getting Information and Help 96 5 10 1 Displaying Tutorials 96 5 10 2 Displaying Help 96 5 10 3 Using the Help Window 97 6 Setting...

Страница 6: ...Contents R S RTO2000 6 Getting Started 1332 9719 02 08...

Страница 7: ...ious acquisitions always available in history buffer Deep toolset for signal analysis Powerful user interface High resolution 12 1 capacitive touchscreen with gesture support Easily customizable wavef...

Страница 8: ...tion on maintenance and instrument interfaces Includes the contents of the getting started manual The online version of the user manual provides the complete contents for immediate display on the inte...

Страница 9: ...R S RTO It also lists the options with their order numbers and optional accessories The brochure provides an overview of the instrument and deals with the specific characteristics See www rohde schwar...

Страница 10: ...rocedure using the touchscreen is described Any elements that can be activated by touching can also be clicked using an addition ally connected mouse The alternative procedure using the keys on the in...

Страница 11: ...ithin the specified ranges Signal outputs are connected correctly and are not overloaded 2 1 Unpacking and Checking the Instrument To remove the instrument from its packaging and check the equipment f...

Страница 12: ...n standing on its feet or with the support feet on the bottom extended Risk of injury if feet are folded out The feet can fold in if they are not folded out completely or if the instrument is shifted...

Страница 13: ...is best if all instruments have the same dimensions width and length If you need to stack smaller instruments on the top the overall load imposed on the lowest instrument must not exceed 250 N If the...

Страница 14: ...the power cable to the AC power connector on the rear panel of the R S RTO 2 Connect the power cable to the socket outlet 3 Switch the main power switch at the rear of the instrument to position I The...

Страница 15: ...boots the Windows operating system and then starts the R S RTO firmware The Power key turns green and the illuminated keys on the front panel light up If the previous session was terminated regularly...

Страница 16: ...print measurement results and screenshots You can connect or disconnect all USB devices during operation of the instrument Installing USB devices on R S RTO is easy under the Windows operating system...

Страница 17: ...To configure the mouse properties 1 Tap the Find icon magnifier on the Windows taskbar 2 Type mouse 3 Select Mouse settings Connecting a printer When printing a file the instrument checks whether a p...

Страница 18: ...e System tab 4 Tap Display Monitors 5 To show the instrument s display content only on the external monitor select Pro jector only To show the instrument s display content on both the oscilloscope and...

Страница 19: ...3 1 Front Panel The front panel of the R S RTO is shown in Figure 3 1 The function keys are grouped in functional blocks to the left and the right of the touchscreen Below the screen vari ous connecto...

Страница 20: ...nect the input signals using active and passive probes The input connectors are provided with a special Rohde Schwarz active probe inter face and they are BNC compatible Thus the instrument can automa...

Страница 21: ...manufacturer Explanation According to section AA 2 4 of EN 61010 2 030 measuring circuits with out any measurement category are intended for measurements on circuits which are not connected to the mai...

Страница 22: ...re the instrument against theft 13 Optional exchangeable hard disk solid state disk option R S RTO B18 or standard hard disk drive option R S RTO B19 14 Lugs to attach the accessory bag AC power suppl...

Страница 23: ...he trigger configuration the values are 50 and 1 M The trigger level can be set from 5 V to 5 V The maximum input voltage is 30 V RMS at 1 M input impedance and 7 V RMS at 50 input impe dance Trigger...

Страница 24: ...t Gen1 Gen2 BNC connectors PattGen Connector for the pattern generator RTO B10 Optional GBIP connector coming with option R S RTO B10 GBIP interface For detailed specifications refer to the data sheet...

Страница 25: ...Performs the action that is assigned to the key in File menu Frontpanel Setup Hardkeys By default the key saves a screenshot of the waveform display Help Opens the appropriate help topic for the activ...

Страница 26: ...re you can define the acquisition processing acquisition mode and waveform arithmetic Resolution Record Length The rotary knob changes the resolution or the record length Press the knob to toggle the...

Страница 27: ...the screen and the scale is stretched or compressed to both sides of the reference point Scale The rotary knob adjusts the time scale for all signals The time scale is also known as timebase Turn cloc...

Страница 28: ...brightness of the color depends on the selected waveform Position upper knob The upper rotary knob changes the vertical position or the offset of the selected wave form The horizontal axis and the sel...

Страница 29: ...s upper and lower level press the knob to toggle between the two levels Source Opens a dialog box where you can select the trigger source Press the key again to switch the source The key lights up in...

Страница 30: ...ors If you press the key while a cursor measurement is enabled the Cursors dialog box opens In the Cursors dialog box you can Configure up to 4 cursor sets Define style and labels of the cursors Conne...

Страница 31: ...asks are used for error detection and compliance tests of digital signals You can Configure masks and masks segments Define mask test parameters Configure actions triggered by mask violation Configure...

Страница 32: ...ursor line or gate in diagrams Turn to move the element that has the focus and press to toggle the focus Esc Closes a dialog box or input box Undo Reverses the last setting actions step by step Undo i...

Страница 33: ...key switches the tabthat has the focus In a table or diagram the key moves the focus in the same way as the key Up arrow Down arrow The up and down arrow keys have the following effects In numeric ed...

Страница 34: ...Instrument Tour R S RTO2000 34 Getting Started 1332 9719 02 08 Keys and Controls...

Страница 35: ...Measurements 49 Performing a Basic FFT Analysis 59 Performing Mathematical Calculations 62 Performing a Search 63 Performing a Mask Test 65 Printing and Saving Screenshots 67 Saving Data 69 4 1 Displ...

Страница 36: ...ource to C2 An unstable waveform is displayed In auto mode the instrument triggers repeat edly after a time interval if no real trigger occurs 6 In the Trigger area press the Mode key 7 Check the Trig...

Страница 37: ...arithmetic methods and display the results in separate waveforms 1 In the Horizontal area press the Acquisition key 2 In the Acquisition tab of the Horizontal dialog box enable all three waveforms Wf...

Страница 38: ...e corresponding signal icons are displayed on the sidebar 4 3 Organizing the Display Now the display has become confusing with so many waveforms in one diagram You can display each waveform in a separ...

Страница 39: ...signal icon for Ch1Wfm2 from the sidebar to the bottom half of the dia gram area The SmartGrid appears and a blue area shows where the waveform will be placed 2 Drag the signal icon for Ch1Wfm3 to the...

Страница 40: ...gram 3 Ch1Wfm3 to Average The diagram titles are shown together with the waveform number that is displayed in the diagram 4 To change the size of a diagram drag its horizontal edge to the required pos...

Страница 41: ...Average Ch1Wfm3 diagram The waveform is switched off its signal icon and the empty diagram are removed 4 4 Changing the Waveform Scaling and Position As you can see on the y axis of the display the ca...

Страница 42: ...hen you quickly set the new trigger level and try out the scaling functions 1 In the Vertical area press the Ch1 key The Vertical dialog box is shown 2 Change the Coupling to AC 3 To close the dialog...

Страница 43: ...on the left and the offset on the right The white value is assigned to the rotary knob while the gray value is not To change the assignment use File menu Hardkey Setup 5 Tap the Find level icon on the...

Страница 44: ...fferent action Alternatively you can Touch the screen with two spread fingers and pinch them together in horizontal direction Tap the Undo icon on the toolbar If you use an active single ended probe y...

Страница 45: ...n in a short video that is available on the instrument File menu Tutorials Zoom 4 5 1 Using the Standard Zoom 1 Restore the default signal channel settings by pressing the Preset and Autoset keys 2 On...

Страница 46: ...Out the Instrument R S RTO2000 46 Getting Started 1332 9719 02 08 The indicated area is magnified in a new zoom diagram The original diagram indi cates the zoom area as a rectangle Zooming into the D...

Страница 47: ...tap Delete on the toolbar and then the zoom window 4 5 2 Using the Fingertip Zoom 1 Tap the Zoom icon on the toolbar 2 In the sidebar tap Fingertip zoom 3 Touch the waveform and move your finger very...

Страница 48: ...the acquisition was stopped and a new acquisition is started with Run Stop or Single the memory is cleared and written anew In the following example you acquire 10 waveforms and display the 3 most re...

Страница 49: ...d enter 1 s to display each waveform for one sec ond 11 Enable the Auto repeat option to see the three waveforms repeatedly 12 Tap Play The currently displayed waveform is indicated in the Current acq...

Страница 50: ...ursor lines appear in the diagram and the Cursor Results box opens The measured waveform values at the cursor positions are displayed 4 You can move the cursor lines in different ways Touch a cursor l...

Страница 51: ...easure the amplitude in the time domain 1 To restore the default signal channel settings press the Preset and Autoset keys 2 Tap the Measurement icon on the toolbar 3 In the sidebar select the measure...

Страница 52: ...press the Meas key in the Analysis area of the front panel 6 Enable the Statistics option 7 Tap Advanced Setup 8 Tap Add Remove Measurements 9 Select the required measurement types For example select...

Страница 53: ...um 8 different measurements on one source can be performed at once simply by tapping the Quick measurement toolbar icon You can configure the mea surement types to be included in quick measurement Thi...

Страница 54: ...e following examples you start a quick measurement and change the measure ment configuration To start the quick measurement 1 Press Autoset 2 Tap the Quick measurement icon on the toolbar 3 Tap the di...

Страница 55: ...ck measurement 1 Tap 2 In the sidebar on the top select the quick measurement if necessary 3 In the sidebar disable the Mean and RMS measurements 4 Scroll down and select Period Now the result box als...

Страница 56: ...quency measurements Tap the icon to adjust measurement specific settings 7 Tap Set as QuickMeas The current configuration is set as default quick measurement and can be repeated until you save another...

Страница 57: ...rrence of measurement values statistically The usage of histograms is also shown in a short video that is available on the instru ment File menu Tutorials Histogram 1 Tap the Histogram icon on the too...

Страница 58: ...stogram tap the Measurement icon on the toolbar 4 Tap the histogram The waveform count for the histogram is displayed 5 To display more measurement results for the histogram press the Meas key on the...

Страница 59: ...he histogram and any measurements based on that histogram are deactivated 4 8 Performing a Basic FFT Analysis During FFT analysis a signal in the time domain is converted to a spectrum of frequen cies...

Страница 60: ...w diagram 3 To measure the spectrum on the math channel tap the Measurement icon on the toolbar 4 Tap the spectrum waveform The channel power is displayed below the FFT diagram 5 Double tap the spectr...

Страница 61: ...e Instrument R S RTO2000 61 Getting Started 1332 9719 02 08 7 If the spectrum analysis option is installed on your instrument the spectrum icon on the toolbar 8 Tap the FFT waveform Performing a Basic...

Страница 62: ...to compare the current measurement result with For example you can display the absolute value of the waveform values as a math waveform 1 Press Autoset 2 Press the Math key 3 In the Setup tab select...

Страница 63: ...windows search To determine the search conditions we use the results of the measurement example described in Chapter 4 7 3 Performing and Configuring the Quick Measurement on page 53 1 Press the Sear...

Страница 64: ...elect Show search zoom windows The acquisition stops and the detected overshoots of the last acquisition are listed in the search result table The search zoom window shows the last result that was fou...

Страница 65: ...t 1 To restore the default signal channel settings press Preset and Autoset 2 Tap the Masks icon on the toolbar 3 Tap the corner points of the first mask segment on the touchscreen Select the cor ner...

Страница 66: ...ce 8 Define the number of tolerable sample hits in the Violation tolerance field A test has failed if the number of sample hits exceeds the limit of Violation toler ance 9 Select the Event Action Rese...

Страница 67: ...llowing examples you print the current display as a black and white graphic with inverted colors i e a black waveform is printed on a white background Then you save some screenshots using the Camera k...

Страница 68: ...er left button and select the printer 6 Tap Print The result is a monochrome image 7 Close the dialog box To configure the Camera key 1 Open the File menu and tap Frontpanel Setup 2 Select the Hardkey...

Страница 69: ...or comparison You can also save measurement results and device settings to repeat or restore previous measurements Saving waveform data on page 69 Saving data of an acquisition series on page 70 Savin...

Страница 70: ...front panel 2 Select Waveform 3 Set the export scope of the waveform a Check the Source b Set Scope to Full Waveform c Tap Data logging to enable export all waveforms of a running acquisition d Enter...

Страница 71: ...ettings Saving and restoring device settings 1 Press the Save Recall key on the front panel 2 Select Savesets 3 Tap Save As Enter the path and filename C Users Public Public Documents Rohde Schwarz RT...

Страница 72: ...Trying Out the Instrument R S RTO2000 72 Getting Started 1332 9719 02 08 Saving Data...

Страница 73: ...web browser and a LAN connection For details refer to the User Manual chapter Web Control Alternatively you can use Virtual Network Computing VNC which requires installation of the VNC server on the...

Страница 74: ...not be used with front panel controls Optional mouse and or keyboard These devices work conform to Windows standards The navigation keys on the front panel correspond to the keys on the keyboard The u...

Страница 75: ...orms channel reference and math waveforms together with histograms masks etc Zoom details XY waveforms spectra and other special waveforms are shown in separate diagrams By default the diagram name co...

Страница 76: ...scale 4 Horizontal position 5 Sample rate 6 RT real time IT interpolated time 7 Trigger mode 8 Trigger type slope or polarity source for A event and B event 9 Trigger level Below each waveform is rep...

Страница 77: ...its time distance from the trigger point of the diagram Position Zoom diagram and zoom area 7 8 Zoomed waveforms are shown in separate zoom diagrams in addition to the waveform diagrams On the origina...

Страница 78: ...the instrument to analyze waveforms and to get measurement results Figure 5 4 shows the control elements on a glance Figure 5 4 Control elements on the touchscreen 1 Toolbar 2 Sidebar see Sidebar 3 o...

Страница 79: ...the settings For details see Chapter 5 6 Displaying Results on page 90 Input box 7 The input box appears if you adjust a value using one of the rotary knobs or if you drag an element on the screen fo...

Страница 80: ...Y waveforms can be created Each XY waveform is built from the voltage values of two source waveforms Digital waveforms The Mixed Signal Option R S RTO B1 provides 16 digital channels grouped in two lo...

Страница 81: ...istogram measurements are performed on the selected waveform All waveform specific settings are applied to the selected waveform of the selected diagram The vertical Position and Scale knobs and the S...

Страница 82: ...To arrange a waveform using the SmartGrid You can arrange waveforms in one of the existing diagrams or in a new diagram The usage of the SmartGrid is also shown in a short video that is available on...

Страница 83: ...h off a minimized waveform tap the Close icon in the upper right cor ner of the minimized signal view Disable Show channel in the Vertical Channels tab Tap the Delete icon Recycle bin in the toolbar a...

Страница 84: ...on page 81 2 Tap the icon of the function in the toolbar 3 Check and adjust the settings in the sidebar on the right 4 To define the analyzed area do one of the following Tap the required diagram Drag...

Страница 85: ...the functions that you do not need Enable the functions that you want to add to the toolbar To display all available toolbar icons tap Show All To hide all toolbar icons tap Hide All 3 To hide the cur...

Страница 86: ...s and then the additional functions Undo Undoes the last setting actions step by step Some actions cannot be revoked locking the touchscreen with Touch Lock and saving data The undo stack is deleted d...

Страница 87: ...s the magnified area To return to the previous display use the Undo function Coupled zoom Zoom Creates a coupled zoom area and its related zoom diagram If you change the size of one zoom area the size...

Страница 88: ...gs Tap the icon and then drag a rectangle on the diagram to mark the histogram area The histogram for the selected waveform appears Touch and hold the histogram area to open the Histogram dialog box M...

Страница 89: ...erforms an autoset or a preset to a default state The icons have the same function ality as the corresponding keys on the front panel They are useful when you control the instrument remotely Run Stop...

Страница 90: ...d from the selected waveform Zone trigger option R S RTO K19 Defines a zone trigger which combines the trigger condition with the intersection or non intersection of one or more zones or masks Tap the...

Страница 91: ...results 1 Press the Display key on the front panel 2 In the Display dialog box select the Diagram Layout tab 3 Under Result box select the Default position Preview result icon on the sidebar Floating...

Страница 92: ...toolbar see Chapter 5 5 Toolbar on page 83 To open a dialog box Perform one of the following actions Tap the required menu and then the menu entry Press the function key on the front panel If a result...

Страница 93: ...election is shown on the list button Tap the list button Then tap the required option Or Use the front panel keys a Press the and keys to navigate to the list button b Press the key to open the list c...

Страница 94: ...methods To use the default value tap Reset if available To use the minimum or maximum value tap Min or Max respectively To increase the displayed value in fixed steps tap Inc To decrease the value in...

Страница 95: ...last character before the cursor 3 Tap Enter to complete the entry To enter numeric data in a dialog box with navigation controls 1 To navigate to the entry field press the and keys 2 To change the v...

Страница 96: ...tGrid Tooltips give a short description of the parameter The context help provides functional description on a setting and the correspond ing remote command The general help explains a dialog box prov...

Страница 97: ...hows the selected help topic Contents contains a table of help contents Index contains index entries to search for help topics Search provides text search The Help toolbar provides some buttons To bro...

Страница 98: ...d same as AND operator For advanced search consider the following To find a defined string of several words enclose it in quotation marks For example a search for trigger qualification finds all topic...

Страница 99: ...re that the instrument has been running and warming up before you start the self alignment The minimum warm up time is indicated in the data sheet Remove the probes from the input connectors 1 On the...

Страница 100: ...og boxes result boxes and other screen information is displayed A reboot of the instrument is not necessary 1 Press the Setup key 2 Select the System tab 3 Tap the Language button The button shows the...

Страница 101: ...kHz for low frequency probe compensa tion 1 Connect the BNC connector of the probe to input CH1 2 Connect the probe s ground connector to the right compensation pin and the tip with the left pin 3 Pr...

Страница 102: ...Setting Up the Instrument R S RTO2000 102 Getting Started 1332 9719 02 08 Adjusting Passive Probes...

Страница 103: ...esults 50 Quick access 87 Trying out 50 D Data entry 93 Data sheet 9 Decimation 37 Delete 88 Diagrams 75 Dialog boxes 78 Background transparency 25 Usage 92 Digital waveforms 80 Display Key 25 Overvie...

Страница 104: ...l trigger mode 29 Numeric data entry 93 O OCXO 24 Offset Channel 28 Trying out 41 OK key 32 On Off key 24 Open source acknowledgment 9 Operation Concepts 73 Manual 73 Options R S RTO B1 MSO 23 R S RTO...

Страница 105: ...rm 83 Switch on Waveform 81 T Temperature Changes 99 Text entry 93 Time base 27 Time scale 27 Toolbar 83 Coupled zoom 87 Cursor 87 Delete 88 FFT 88 Find level 89 Hardware zoom 87 Hide show icons 84 Hi...

Страница 106: ...2 9719 02 08 Reference 80 Select 81 States 81 Switch off 83 Switch on 81 XY 80 Zoom 80 Web interface 73 Windows Access 16 X XY waveforms 80 Z Zoom Area 77 Diagram 77 Fingertip 47 Key 31 Quick access 8...

Отзывы: