background image


Provide your feedback 

As you use Ruskin to manage your RBR loggers, you may have questions or issues that 
are not addressed in this guide. At such times, we would like to hear from you. 

Steps 

1.  From the Help menu, click Comment on Ruskin. 
2.  The Feedback to RBR dialog box appears. 
3.  Identify yourself and summarize your comments. 
4.  Provide a detailed description and add any attachments, if required. 
5.  Click OK.  

We will respond to you using the email address that you provide.


Installation 

Install Ruskin on a PC 

You can install Ruskin on a Windows computer that uses the XP or Vista operating system.  

November 5, 2010


Rev1.4 

3

Содержание RUSKIN

Страница 1: ...RUSKIN USER GUIDE Datalogger Manual rbr global com...

Страница 2: ...ections for N Point Calibration and Metatables 1 3 June 25 2010 Include tide and wave information for TWR Include Rinko calibration note 1 3 x July 6 2010 Event and Error Stamps descriptions multiple...

Страница 3: ...pdate Ruskin 5 CONFIGURATION AND SCHEDULING 6 Getting started with Ruskin 6 Stop logging 7 Use a simulated logger 8 View information about a logger 8 Configure a logger 9 Averaging 11 Thresholding and...

Страница 4: ...ard DO Calibration 29 AMT pH Calibration 30 Seapoint Turbidity Calibration 32 Hydrotide Druck Pressure Sensor Calibration 34 Alec Rinko Optode Calibration 35 PREFERENCES 36 Specify directories for out...

Страница 5: ...r 44 Changing the batteries 46 COMMUNICATING WITH THE LOGGER 47 1050 2050 and XR series loggers 47 DEPLOYMENT 49 MAINTENANCE AND REPAIRS 50 Support kits 50 O rings 50 Repairs 52 Calibration 52 APPENDI...

Страница 6: ...t to us for repair all other costs including return shipment will be borne by RBR Ltd This warranty does not cover consumables or normal wear and tear nor does it cover damage caused by negligent use...

Страница 7: ...le from the Help menu in Ruskin For information about operating and maintaining the RBR submersible data loggers see the RBR Submersible Logger Hardware section of this manual p 44 It will tell you ho...

Страница 8: ...u click Comment on Ruskin 2 The Feedback to RBR dialog box appears 3 Identify yourself and summarize your comments 4 Provide a detailed description and add any attachments if required 5 Click OK We wi...

Страница 9: ...drive 2 After the CD ROM mounts open the drive and double click the Ruskin package 3 Follow the installation instructions Although you can specify a different folder for the working directory for the...

Страница 10: ...a newer version The installation program deletes the older files before installing the newer ones It does not delete any Ruskin data files or log files The most recent version of Ruskin is always avai...

Страница 11: ...rties view on the right side of the Ruskin window For more information see View information about a logger on page 8 4 If you want to see live data sampled every few seconds but not saved select the s...

Страница 12: ...he Setup Basic Configuration tab the streamed data is not stored in the logger memory 9 If you want to download data click the Download tab to download all the data saved since your schedule was enabl...

Страница 13: ...ng LED check box If you want to view live the data samples that you schedule select the Streaming check box If you want the logger to convert raw data to printable ASCII characters in an engineering f...

Страница 14: ...automatically on power up The logger sets the time to 2000 Jan 01 00 00 00 on power up and starts logging at 2000 Jan 01 00 00 10 The end time is set to 2004 Jan 01 and the sampling period that you p...

Страница 15: ...duration must be shorter than the sampling period For more information see Averaging on page 11 Notes 1 Your logger may not support this feature 2 When you use the thresholding option averaging canno...

Страница 16: ...veraging period which begins at the start of the next sampling period For example if your sampling period is five seconds and you want to average the readings over three seconds the following happens...

Страница 17: ...samples are not stored until the next time the logger checks for the thresholding condition and finds that it is met Note that Ruskin enforces an hysteresis period that is a multiple of your sampling...

Страница 18: ...nd its configuration is different from that of the other RBR loggers For information about configuring the other loggers see Configure a logger on page 9 If your logger is already logging data when yo...

Страница 19: ...t view because Ruskin converts the data back to the raw format 4 If you can see your logger case while it is deployed and want a visual indication that the logger is running select the Enable sampling...

Страница 20: ...nge of wave frequencies that can be measured In particular read only values for wave analysis bandwidth and wave periods will appear Ruskin will calculate the actual depth from the measured pressure d...

Страница 21: ...Whenever the Setup Schedule tab is in focus the battery is being used as indicated by the battery icon on the tab and the animated battery icon in the Navigator view You should display the Information...

Страница 22: ...able your logger as scheduled Ruskin estimates how long your battery will last using battery capacities of 1000 mAh Actual battery life is affected by your battery capacity and the temperature during...

Страница 23: ...strument to the deployed logger to listen to the logger and take action under certain conditions For example when a temperature reading exceeds 30 degrees Celsius the connected instrument makes a call...

Страница 24: ...t the connection may fail with a message 2 If you want to add notes that will be stored with the downloaded data add them in the Comment box Your comment will be visible on both the Overview and Sourc...

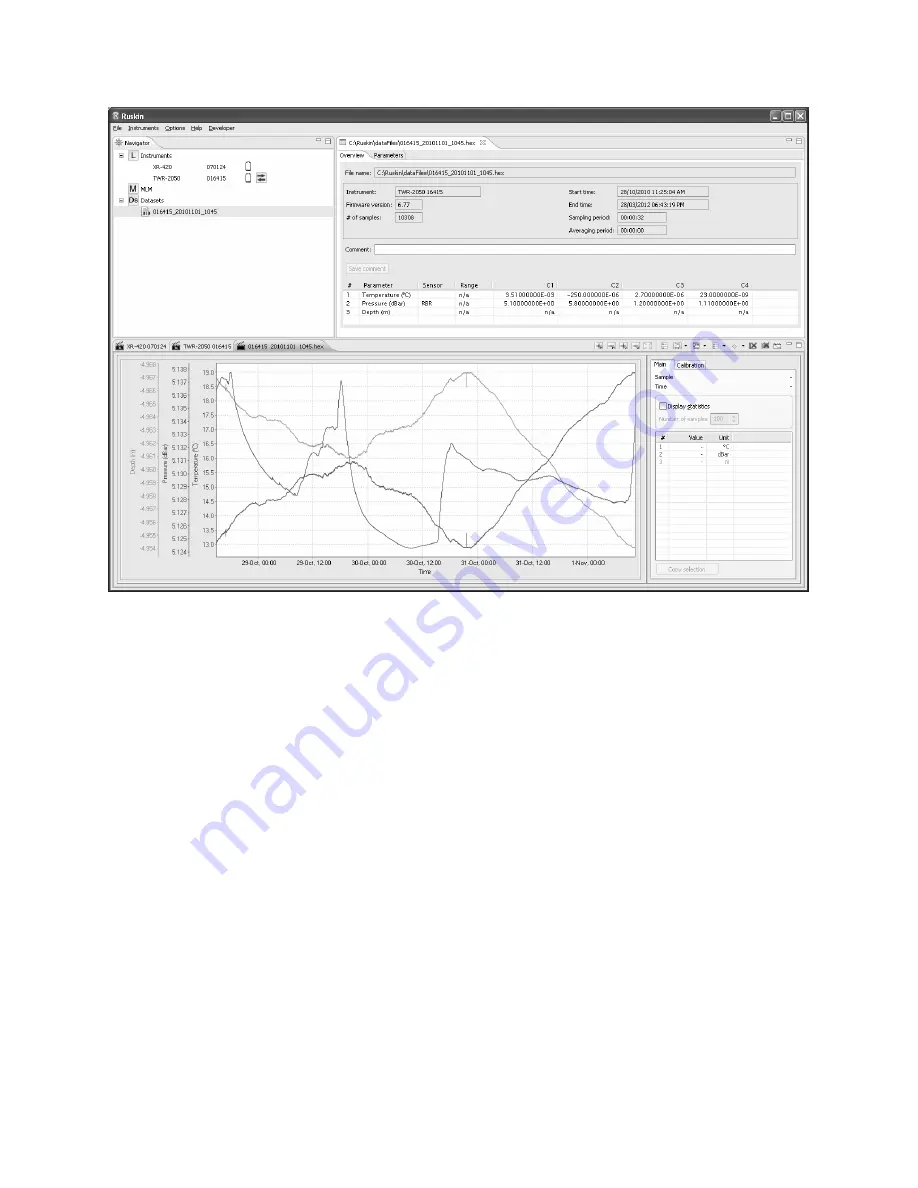
Страница 25: ...From the File menu click Open dataset and double click the hex file that contains the data that you want to view or you can click one of the recently opened datasets shown in the menu The name of the...

Страница 26: ...corner For a TWR 2050 dataset you can select the Show waves check box to view a plot that shows the height of waves If you want to copy the data to the clipboard and then paste it into another applic...

Страница 27: ...ally The expansion or contraction is centered around the vertical black line in the plot If no line exists the focus is in the centre Tip To place or move a vertical black line click the time in the p...

Страница 28: ...ta Show hide channels Click the button and select which channels to show in the Plot view You can choose to show or hide specific channels used by your logger or all the channels of a particular type...

Страница 29: ...e the graphical display so that the depth channel becomes the vertical or y axis and all other channels are plotted along the horizontal or x axis Tip Click the maximize button to more easily view the...

Страница 30: ...iew Clear plot Click the button if you want to delete all the data in the Plot view for all channels Note Any data stored on the logger is preserved Tide and Wave Display When data has been downloaded...

Страница 31: ...ataset or opened an existing dataset Steps 1 Right click the dataset whose data you want to export and click Export as or use the File menu 2 Choose the type of file that you want to create To work wi...

Страница 32: ...ta files box Options menu Preferences dialog box General You can change the location for this file which will also change the default location By default the file name for a dataset plot is that of th...

Страница 33: ...out an entire row or the entire table Note Individual columns of data cannot be copied If copying a single row highlight the row in the table and then click Copy from selected row If copying the entir...

Страница 34: ...synchronized to the PC clock and ensure the end time is set so that the logger will keep sampling until calibration is complete 2 Fill the beaker with water and install the magnetic stirrer ensuring t...

Страница 35: ...tion tab will now show the average value and standard deviation for the range of samples set in Step 7 10 Click in the Real Avg field in the Calibration tab and select the value 100 for 100 oxygen fro...

Страница 36: ...at a copy of the data is saved as well 4 The calibration data should now be displayed in the Plot view Click the Calibration tab in the Properties view to the right of the Plot view 5 Select the pH se...

Страница 37: ...interval Use Sync to PC to ensure the logger clock is synchronized to the PC clock and ensure the end time is set so that the logger will keep sampling until calibration is complete 2 Flush the senso...

Страница 38: ...as per the steps in the Download section on page 19 of this manual Make sure that a copy of the data is saved as well 11 The calibration data should now be displayed in the Plot view Click the Calibr...

Страница 39: ...t depth value 4 Retrieve the data from the data logger as per the steps in the Download section on page 19 of this manual Make sure that a copy of the data is saved as well 5 The calibration data shou...

Страница 40: ...your data logger using the Ruskin software Steps 1 With the logger connected to your computer and Ruskin open click on the Calibration tab in the Properties view 2 You will notice that the calibratio...

Страница 41: ...files plotting preferences adding depth as a derived channel adding derived channels related to conductivity adding dissolved oxygen as a derived channel calculating derived channels when sensors are...

Страница 42: ...t on the left side of the Preferences dialog box click Plotting 3 Specify whether you want to hide by default any measured channels that are used only to create derived channels For example you may wa...

Страница 43: ...he Depth tab select the Enable Depth Channel check box 4 In the Atmospheric Pressure box type a deciBar value for the atmospheric pressure on the logger or use the default value This value corrects th...

Страница 44: ...d C4 respectively a is a function of the coefficient of linear expansion of the ceramic centre of the conductivity sensor b is a function of the zero drift of the conductivity sensor as a function of...

Страница 45: ...k Derived Channels 3 Click the Dissolved O2 tab and select the Enable Dissolved Oxygen Channel check box 4 If any of your loggers use the Oxyguard DO sensor to measure oxygen saturation and you want t...

Страница 46: ...ex sensors that use serial interfaces are integrated in the logger through an RBR generic serial card Each serial card must be configured for the particular sensor using a meta table Meta tables are s...

Страница 47: ...selecting the correct channel number from the drop down list Get table from interface Pressing this button retrieves the current meta table stored in the card and displays it in the Editor area Confi...

Страница 48: ...n the View and Edit area to the serial card channel number selected Be careful when sending meta tables to the card to ensure you do not send unintended information to the card To ensure that only the...

Страница 49: ...rised Carefully draw the end cap away from the body sliding the attached inner assembly out of the case XR loggers XR series loggers have two end caps the sensor end cap houses the sensors and the bat...

Страница 50: ...e Inspecting the O rings section p 10 before deploying the logger Do not use excessive force when tightening the end cap hand tight is quite sufficient as the seal depends upon the O rings not the end...

Страница 51: ...ger The batteries are held within their casing by the force of a single spring Press firmly upon the negative end of the battery furthest from the spring and pull it out of the casing XR loggers To re...

Страница 52: ...mmunicating with the logger 1050 2050 and XR series loggers Using the internal data port To establish a link between the logger and a computer open the logger and locate the RJ 11 jack mounted at the...

Страница 53: ...0 contact surfaces must be dry prior to mating Lubricate O rings with Dow Corning 111 Valve Lubricant or equivalent Keep O ring grooves clean and avoid cuts and nicks in the O ring Replace O rings whe...

Страница 54: ...the logger 1 Heed the maximum pressure rating All RBR loggers with pressure sensors are individually rated to a maximum depth pressure This is indicated by the label which is placed on the logger s s...

Страница 55: ...ting surfaces free from particles of grit hair or small scratches in order to preserve a seal Before deploying the logger carefully inspect the O rings that are required to maintain a seal 1050 2050 s...

Страница 56: ...rfaces of the O ring groove doing so will probably render the end cap useless Slide the O ring out of its groove and off the logger The O ring may need to stretch quite a bit as it is pushed off this...

Страница 57: ...Please contact us immediately if you are experiencing problems with your RBR product It is very important to contact us before returning your instrument as some difficulties can be easily solved on s...

Страница 58: ...Ruskin Software calculates the expected battery usage in mA Hours mAh for the logger during setup see Ruskin User Guide The nominal capacity of the batteries is 1300mAh at room temperature The softwa...

Страница 59: ...trongly suggest that the O rings be replaced regularly e g before every deployment or after change of batteries or at least once a year 1050 and 2050 series loggers Plastic End cap O ring 2 214 N70 10...

Страница 60: ...ndicate very rare fault conditions Some may also occur together in various combinations with no sample data between them TIM is used to ensure timing synchronization whenever there is a possibility th...

Страница 61: ...ding from every channel in the logger within the burst a burst contains only readings from the pressure channel The number of readings present will be the wave burst length The time between the readin...

Страница 62: ...ry TTY indicates a serious failure of communication with the host in which the logger was unable to send data over the serial connection because of an internal problem although it may be able to recov...

Отзывы: