


Trying out the instrument
R&S
®
RTE
66
Getting Started 1326.1026.02 ─ 10
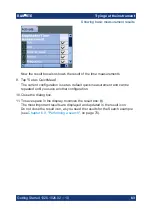
Both the histogram and any measurements based on that histogram are deac-
tivated.
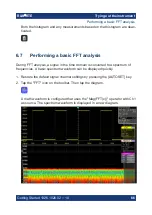
6.7
Performing a basic FFT analysis
During FFT analysis, a signal in the time domain is converted to a spectrum of
frequencies. A basic spectrum waveform can be displayed quickly.
1. Restore the default signal channel settings by pressing the [AUTOSET] key.
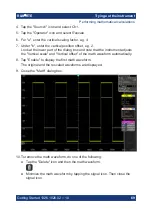
2. Tap the "FFT" icon on the toolbar. Then tap the diagram.
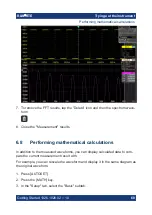
A math waveform is configured that uses the "Mag(FFT(x))" operator with Ch1
as source. The spectrum waveform is displayed in a new diagram.
Performing a basic FFT analysis


