


Operation of the Software PVPM.disp
Page 30
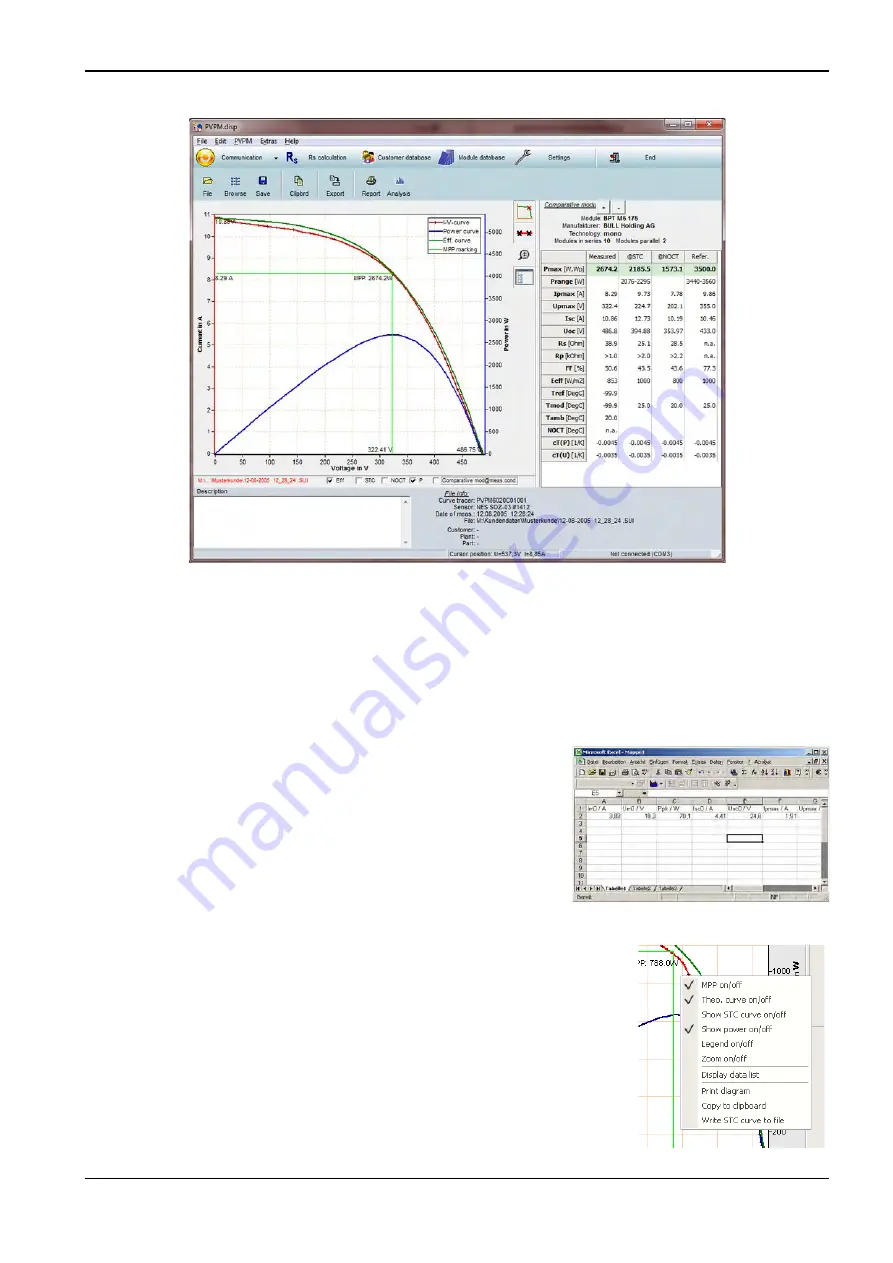
11.4 Diagram
After loading the data of a measurement the diagram will be displayed.
In the diagram you can draw up a rectangle with the mouse cursor (from top left to bottom right with pressed left
mouse button). This marked region then will be displayed zoomed. To come back to normal view just click onto
the drawing region. If you press the Shift-Key and the right mouse button in the viewing area and keep the
buttons pressed, you can move the diagram area in every direction (pan).
A modification of the data is at present only possible in the fields irradiation and temperature: a double click on
the displayed value opens a dialogue box, in which you can enter the new value. The changed values remain, if
the file is now stored to disk again.
Into the field „remark “you can write your notes. These are stored along
with measured data. The first line of the remarks is used as title of the
diagram.
With the button “Clipb” you can copy important data in a tabular form to
the clipboard and then for example into MS Excel.
So you can easily setup a table of different measurements and
compare them using a software other then PVPM.disp without
exporting the files.
Clicking the viewing area with the right mouse button lets a popup menu appear.
The same functions are available if you use the buttons on left of the diagram
region. The following options are available:
11.4.1.1 MPP display on/off (button “Show MPP”)
You can select whether the MPP shell be displayed in the diagram or not. Note: The
displayed MPP is not exactly one of the measured data points but will be
interpolated and thus more precise
PVPM 1000X / 1040X
User Manual
PV-Engineering GmbH


